I build Power Platform solutions for real business problems.
I create effective and engaging eLearning.
Featured Work
Instructional Design & eLearning
Software Development & Data Analysis
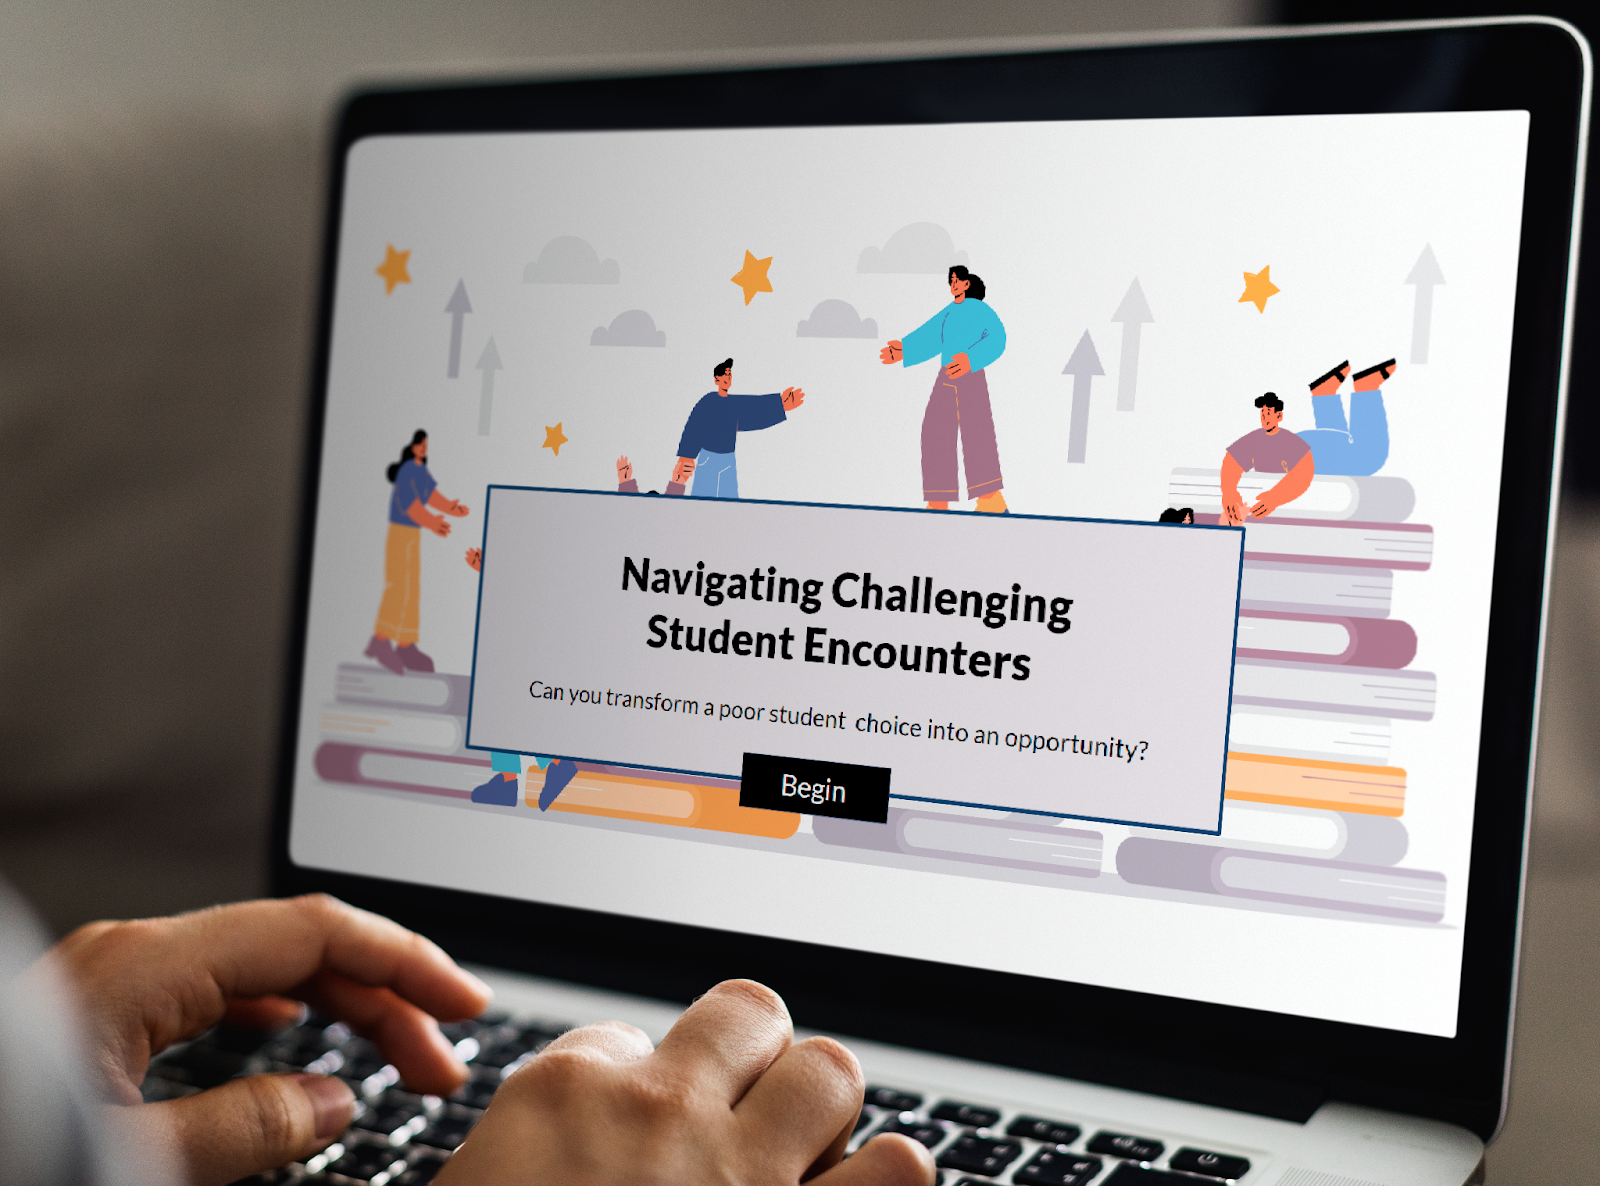
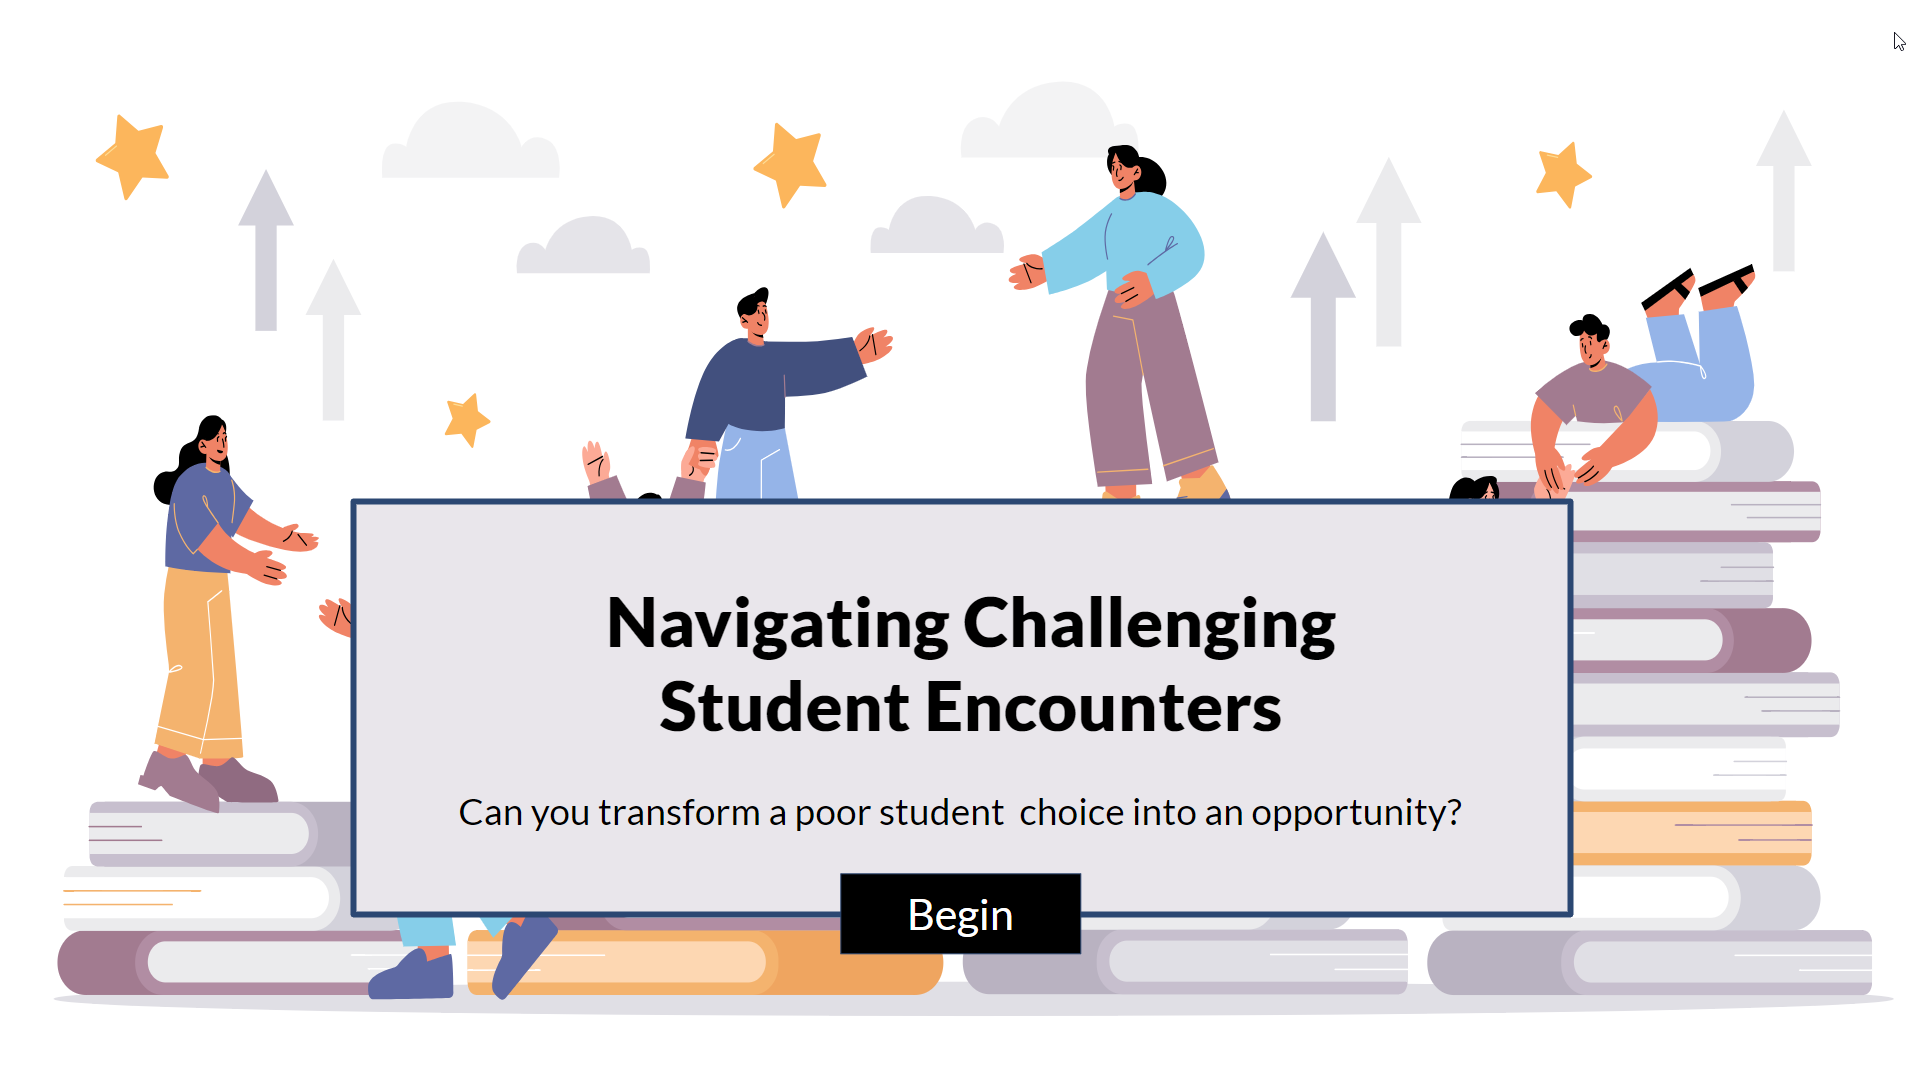
Challenging Student Encounters
an immersive scenario
A scenario-based eLearning concept project for online high school instructors.
It guides them to use empathy and transparency when dealing with challenging student and parent situations.
Articulate Storyline 360, Figma, Inkscape, Mindmeister, Google Docs
Instructor Certification Program
leveraging the Power Platform
A set of tools for scheduling, tracking, and evaluating candidates in a "train-the-trainer" program.
Automated data flows and Power BI reporting give actionable information.
Dataverse, Power Apps Canvas, Power Automate, Power BI, HTML, JavaScript, Node.js, APIs, MS Graph, MS Office, MS Teams, Outlook
[spacer]
[spacer]
Math Quiz Readiness
xAPI-enabled with JavaScript
Measure and record a math student's readiness for
an upcoming test, combined with analysis tools for instructors.
Record, track, and monitor the progress of my 2026 job hunting.
Use data analytics to gain further insight.
Power Apps Canvas, Dataverse, Power Automate, Power BI, Excel
[spacer]
[spacer]
Italy's Wine Regions
an informational exploration
Learn about Italy's wine regions in a fun and visually appealing way.
This is a proof-of-concept demonstration of some advanced Articulate Storyline features.
Articulate Storyline 360, Figma, Inkscape, Mindmeister, Google Docs
Course FAQ tools
for instructors and students
A web app to author FAQ items for online instructors.
The results are displayed in an intuitive format for students, easily embedded in any web page
as well as in common Learning Management Systems.
Learn to use empathy and transparency in challenging student and parent situations.
Articulate Storyline 360, Figma, Inkscape, Mindmeister, Google Docs
[spacer]
[spacer]
The Problem
The client is APlus Online Academy, a hypothetical online for-profit school delivering course material for grades 6-12.
The client noted the number of complaints from parents and students regarding transparency, empathy,
and clarity in communication had increased.
Stakeholders reported these concerns in the context of difficult conversations around many topics,
including academic integrity, reporting student progress, and appropriate assignment feedback.
[spacer]
[spacer]
The Solution
I developed a scenario-based eLearning solution for many reasons:
The instructors live in many locations, and many work part-time. A self-paced eLearning situation is a good fit for those needs.
A scenario-based experience in a risk-free environment will increase the instructors’ familiarity with difficult conversations and provide
practice applying them in realistic situations.
The entire staff of instructors will engage with the learning solution, which will promote consistent and appropriate applications of the techniques.
The solution will be available for training new instructors as they join the company and for refreshers when needed.
I considered and decided against alternatives, including live workshops,
compiling and sharing customer service data, and creating job aids
summarizing vital policy points. The scenario-based learning is focused
directly on changing instructor behavior, while job aids and analyzing
customer service data are not. Live workshops would be less efficient
and cost-effective than the scenario-based approach.
[spacer]
[spacer]
[spacer]
My Process
As I have experience coaching online instructors, I served as a Subject
Matter Expert (SME). I leveraged this experience to create an action
map and focus items for the scenario. These formed the basis for a
text-based storyboard. I then made a mood board, style guide, and visual mockups
using Figma. I used these artifacts to develop an interactive prototype,
implementing a portion of the scenario in Articulate Storyline.
Finally, I implemented the entire project in Storyline.
At each stage, I asked for and used feedback from colleagues within the online
teaching industry and the instructional design field.
[spacer]
[spacer]
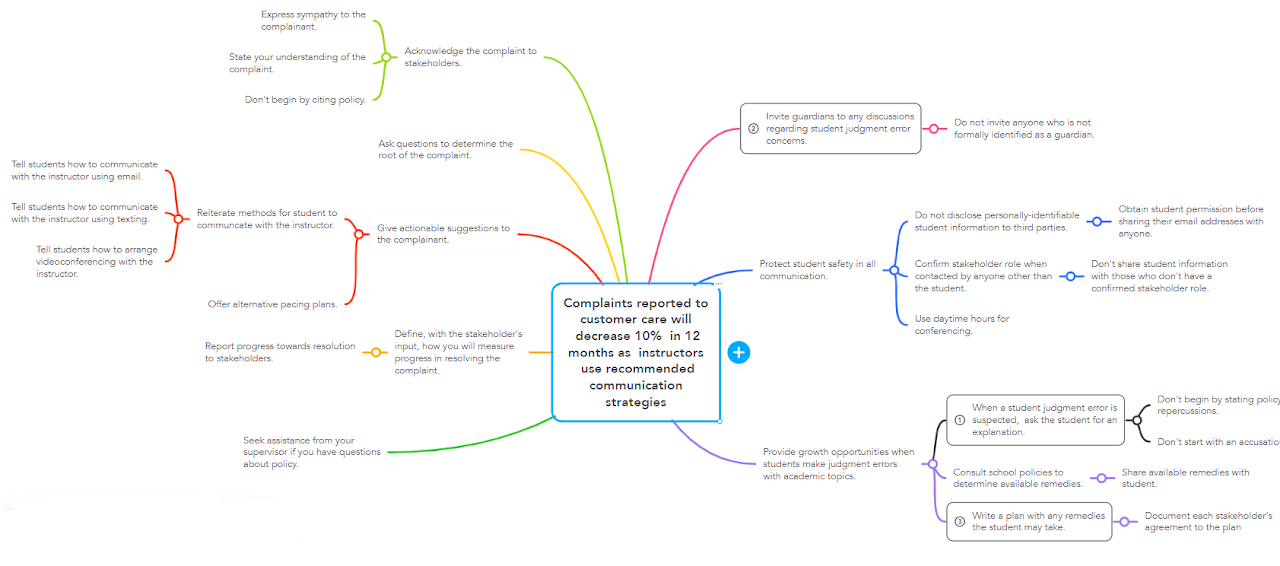
Action Map
First, I defined a specific measurable and time-bound improvement and built
an action map around it. I identified recurring problematic instructor
interactions and prioritized them, along with recommended responses.
I picked three high-priority problems to build the eLearning experience.
Each focuses on what the instructor should (and shouldn't) do to create a positive customer experience:
When a student judgment error is suspected, ask the student for an explanation.
Invite guardians to any discussions regarding student judgment error concerns.
Write a plan with any remedies the student may take.
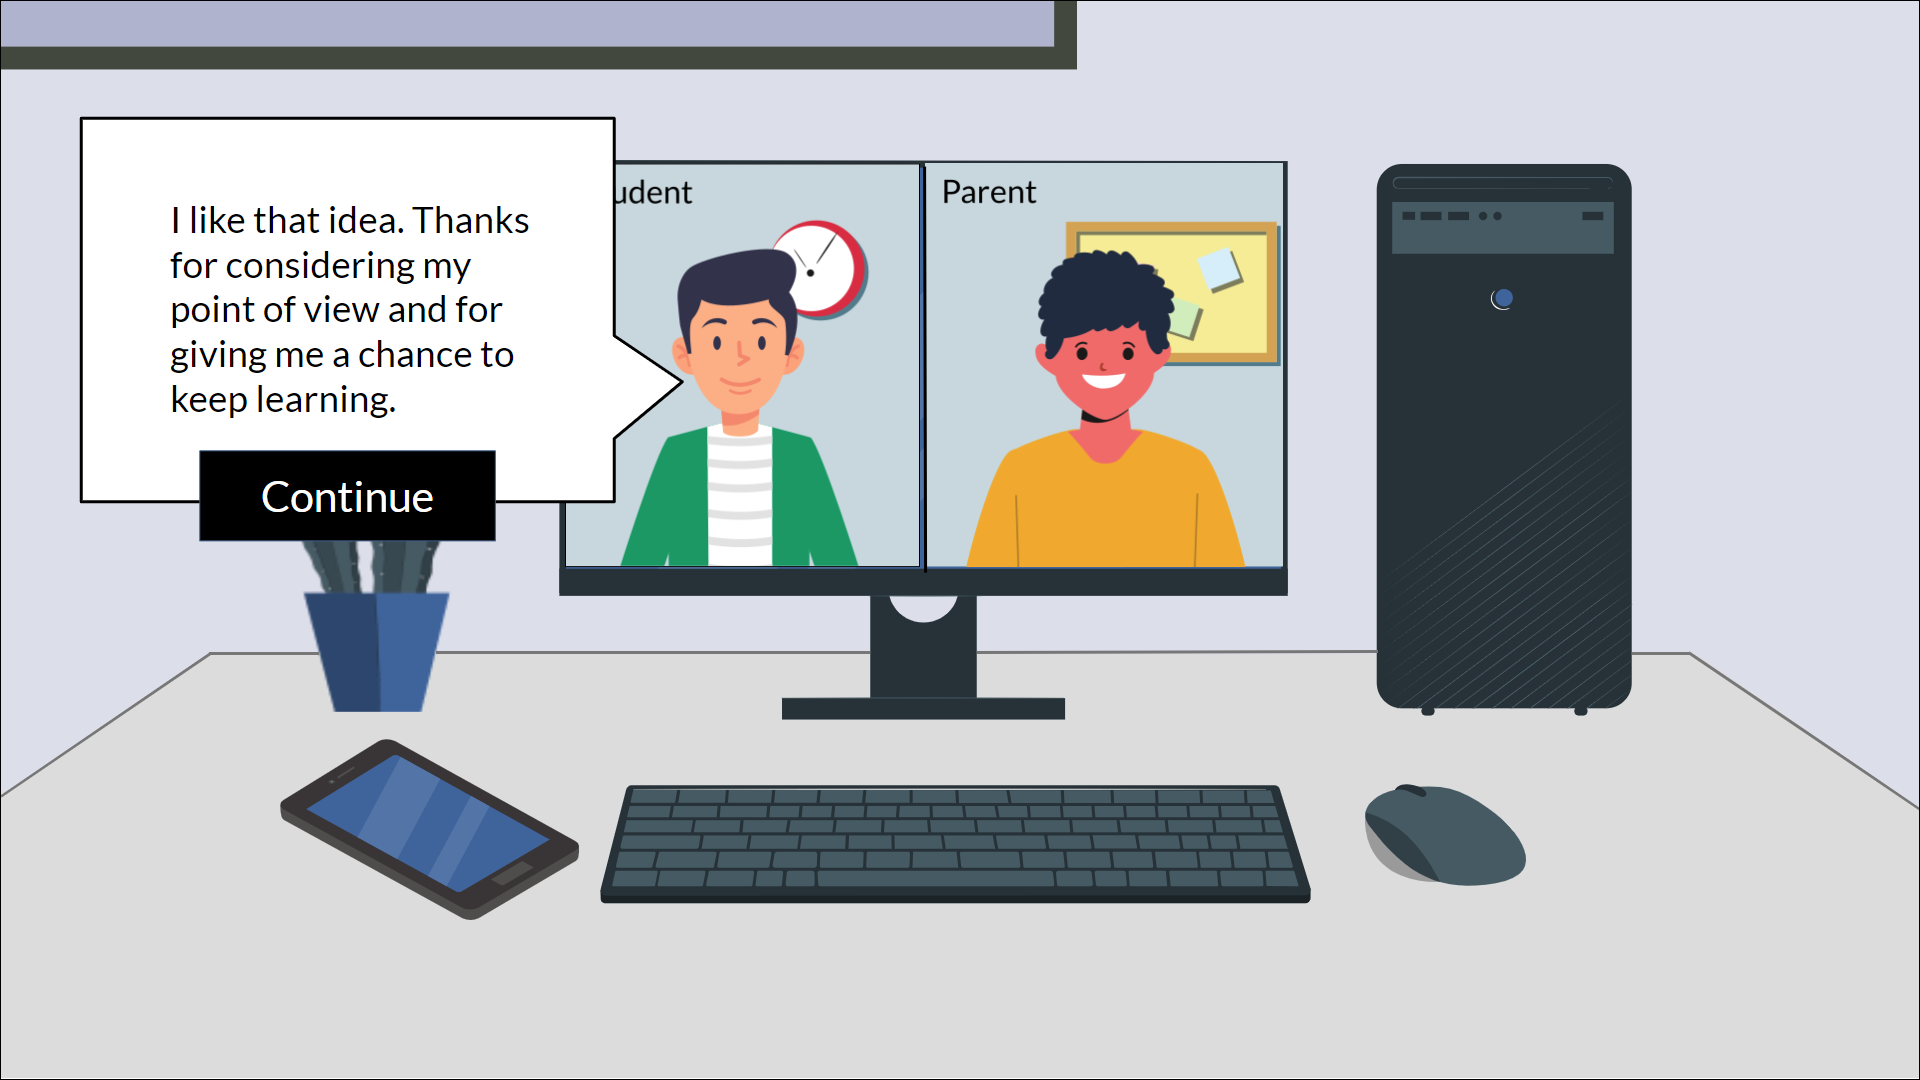
The heart of the intended experience is anticipating an instructor's "incorrect" choices and guiding them to better ones.
[spacer]
[spacer]
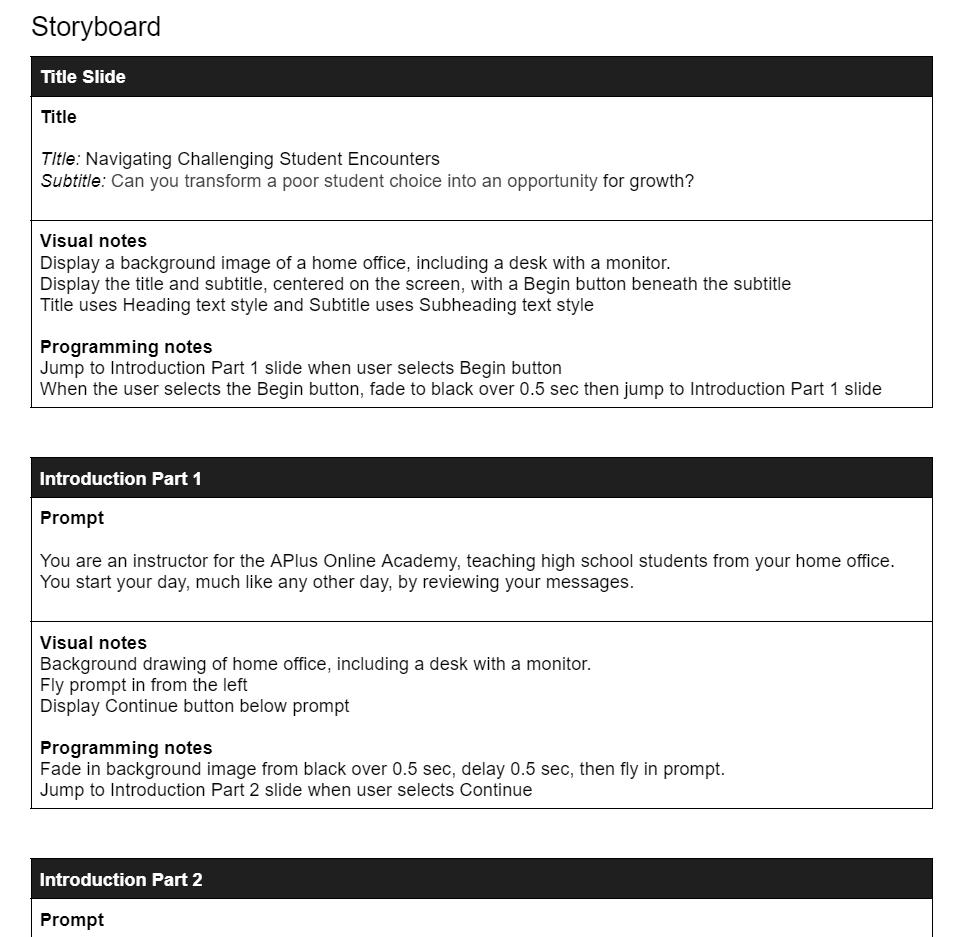
Storyboard
The three focus items from the action map are the basis for my text-based storyboard.
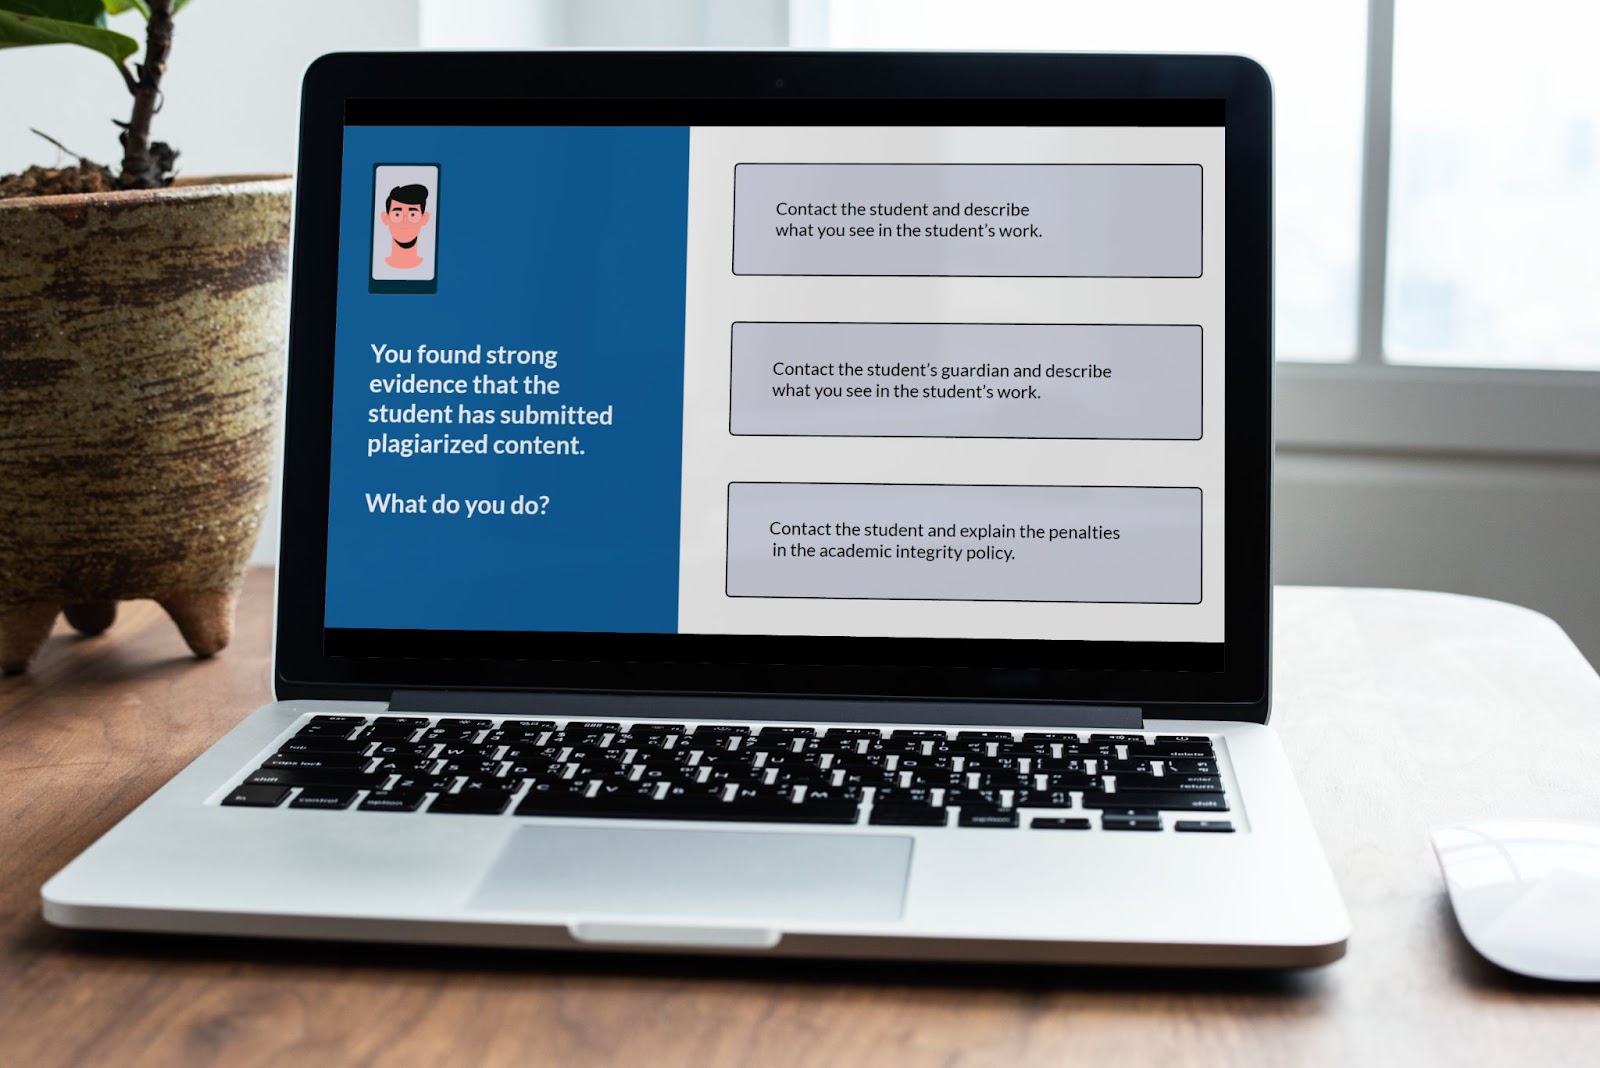
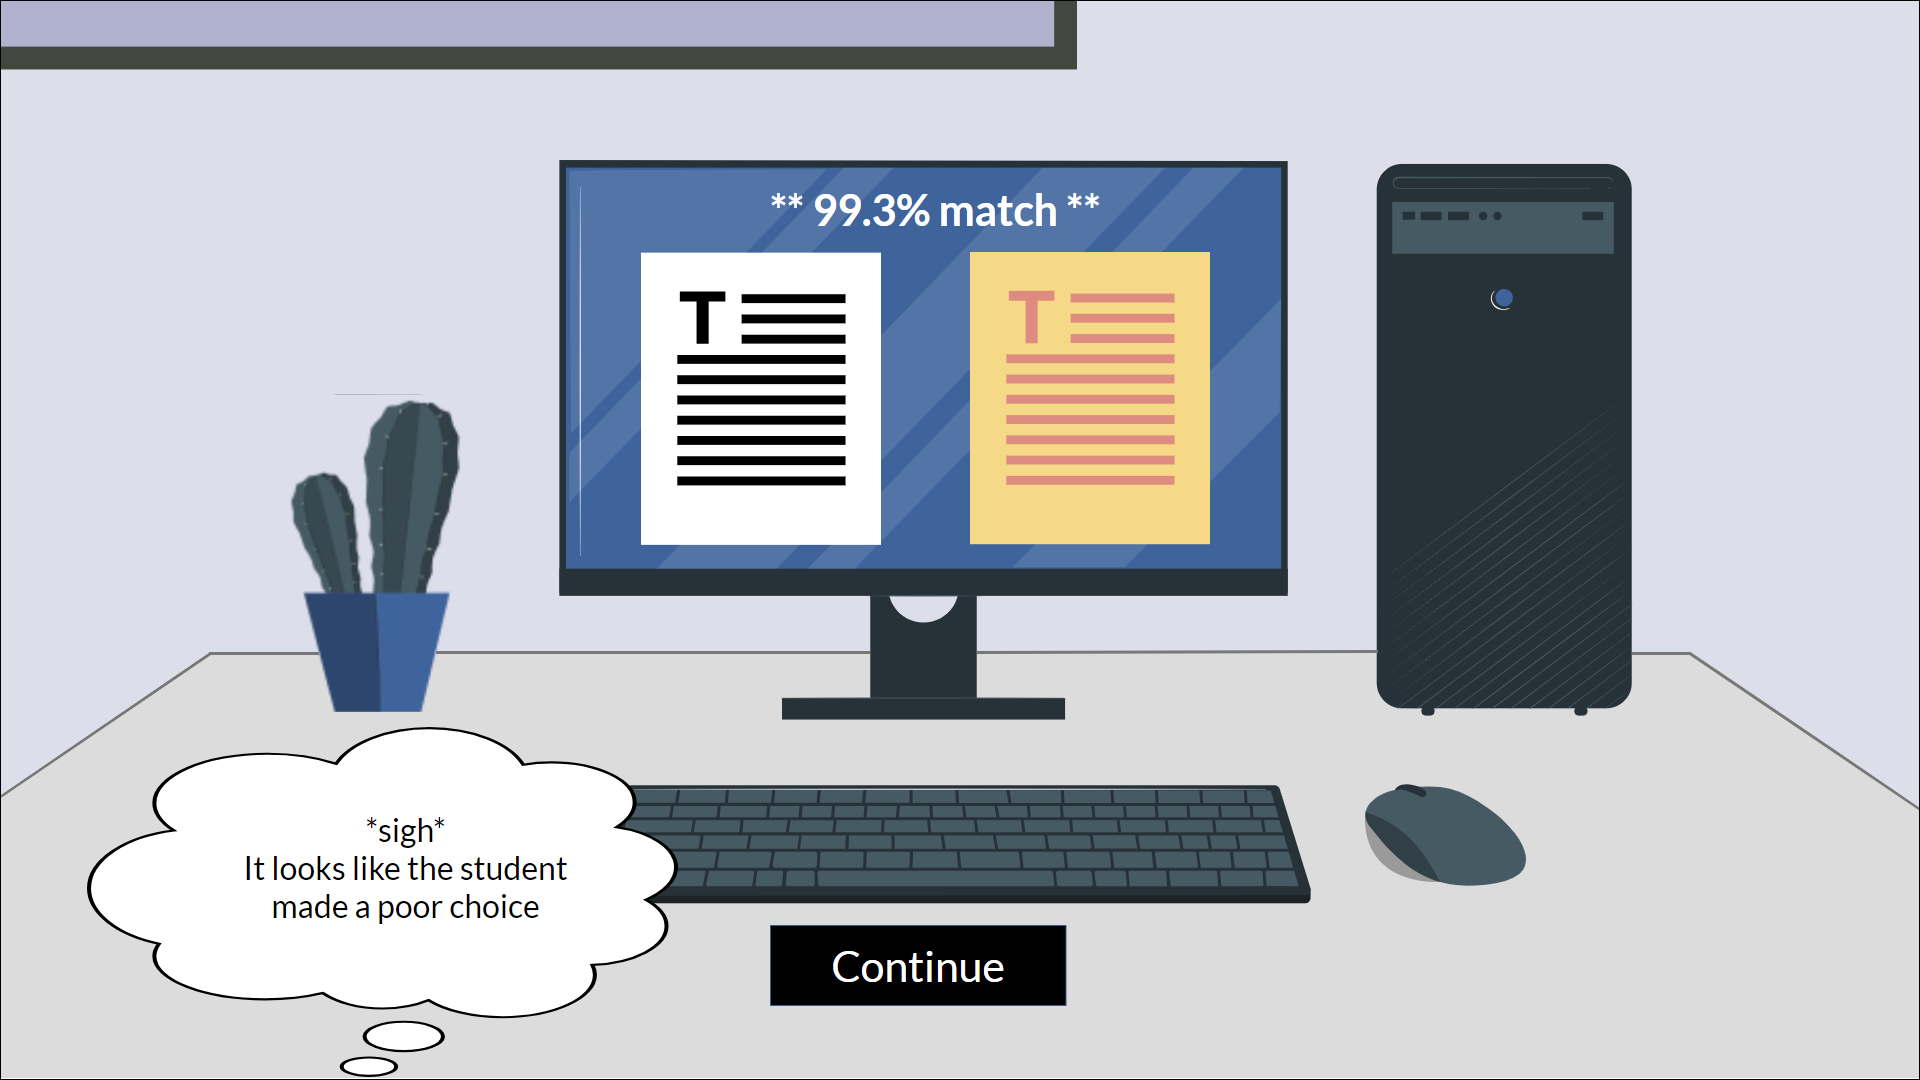
The learner faces a challenging student plagiarism situation and three questions.
Each question proposes three response actions: a correct one and two that are less effective.
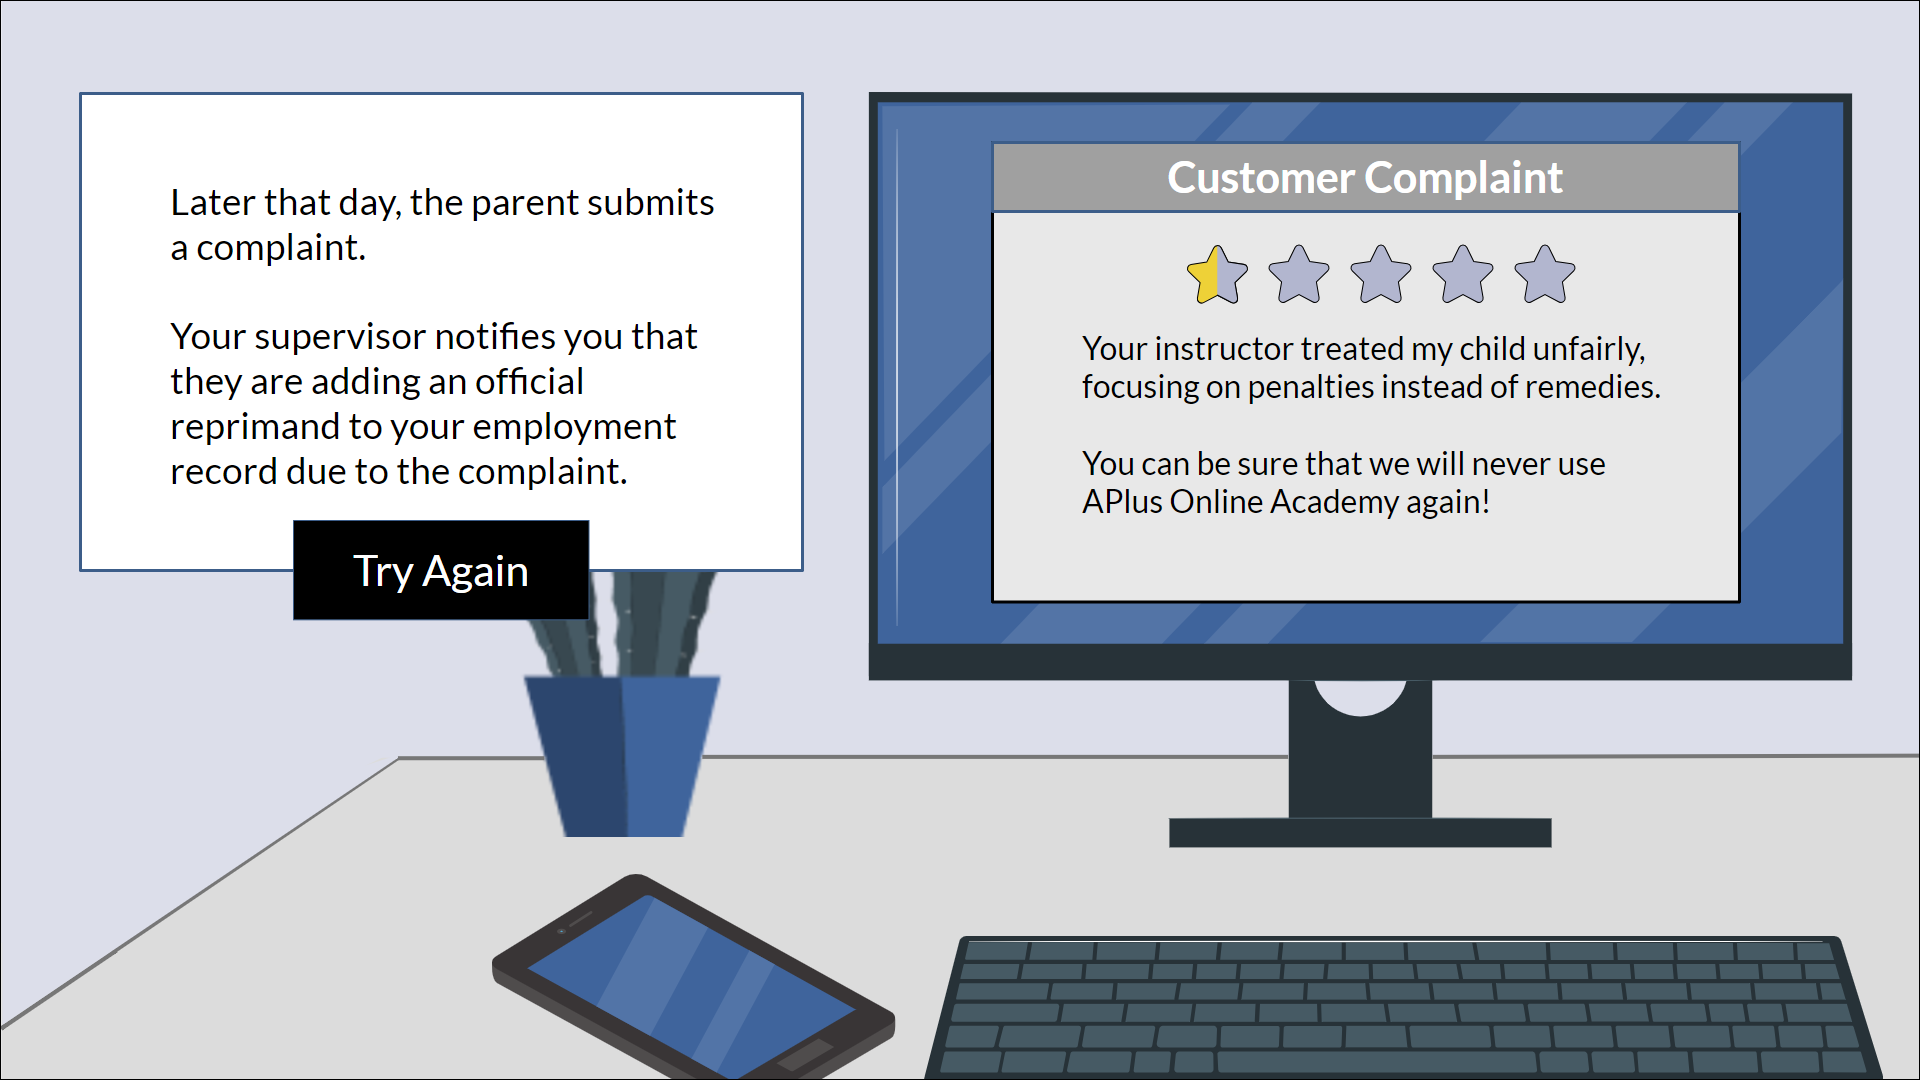
A positive or negative consequence will occur based on the learner's choice.
For negative results, the learner loops back to repeat the question;
otherwise, they continue to the next one. In the initial stage-setting scenes,
the learner meets a mentor character. The learner can seek advice from this
character at any decision point.
The storyboard development was a critical opportunity to design authentic and
rigorous consequences and to focus on "show rather than tell," relying on
the learner's immersion in the story to provide information rather than
explicitly stating it. This approach increases both engagement and memorability.
As with the other development phases, I relied upon several feedback and revision
cycles, using my colleagues' generous input.
[spacer]
[spacer]
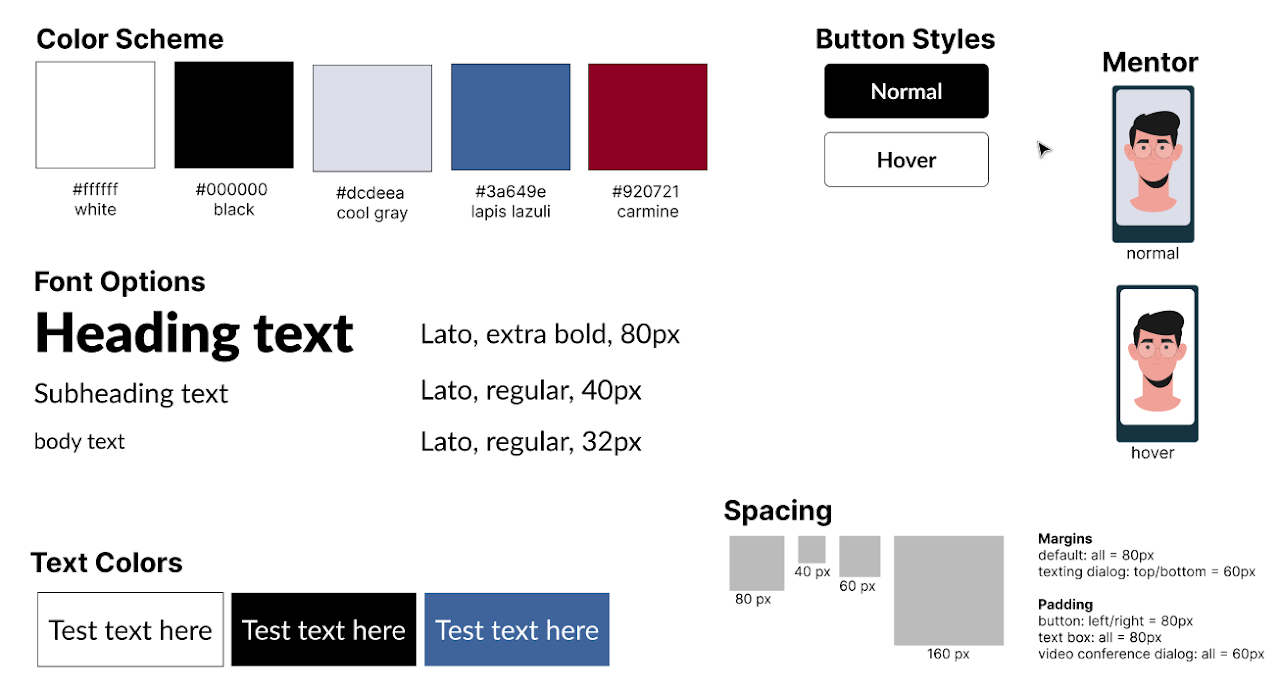
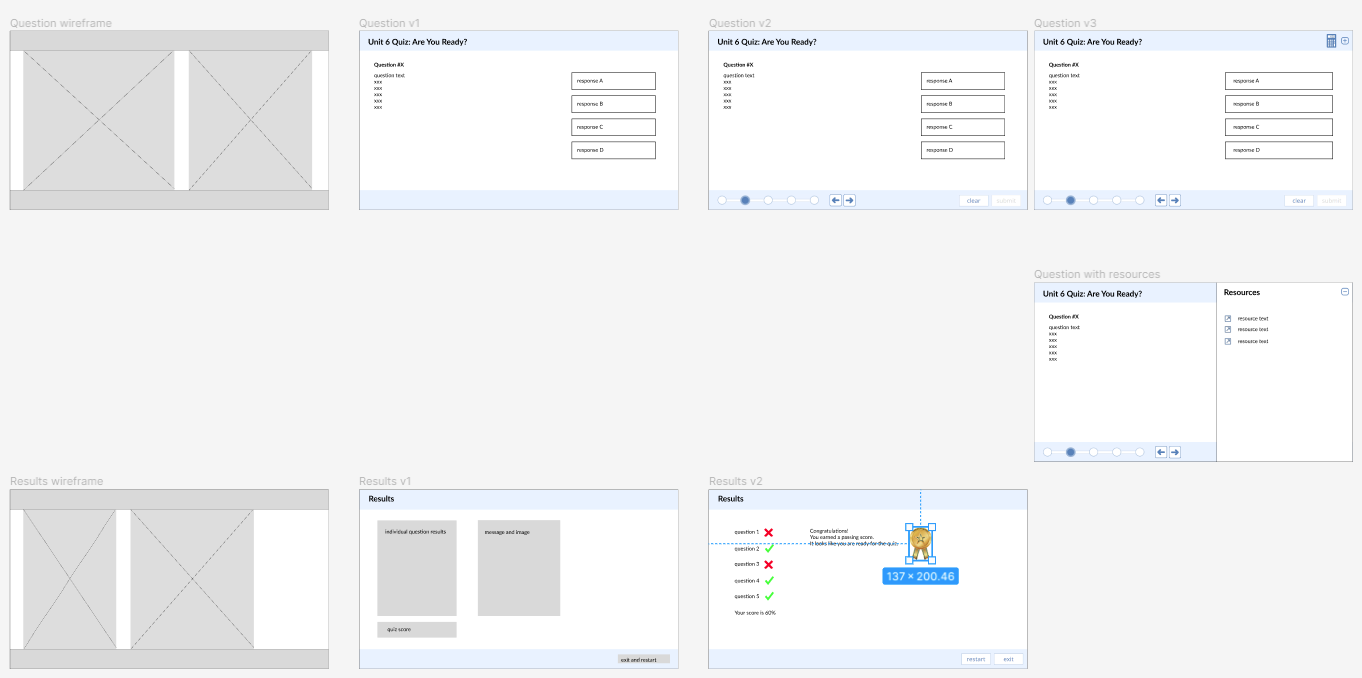
Style Guide and Mockups
I developed a style guide and visual mockups using Figma. I made the
style guide to ensure consistency in common elements such as
color scheme, fonts, spacing, and buttons.
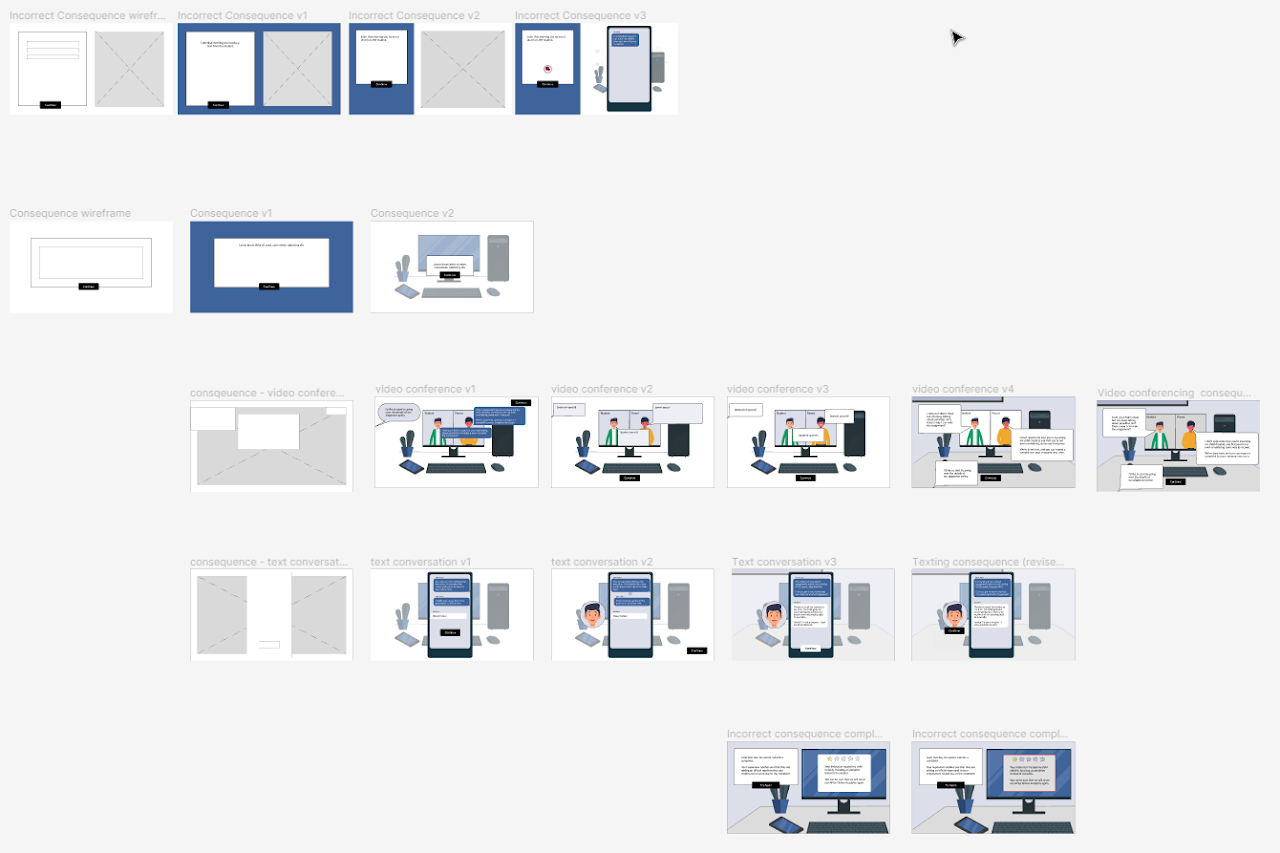
Using Figma allowed me to iterate quickly through variations on the mockups,
beginning with a wireframe. I could define and modify common elements,
reuse them quickly, and play with a rough prototype of the whole scenario.
This flexibility was handy as I received feedback from reviewers and worked
to incorporate improvements into the design.
This image shows how the video conference and texting layouts evolved from
simple wireframes to their final state.
[spacer]
[spacer]
Interactive Prototype
Next, I built an interactive prototype in Articulate Storyline. It included fully developed
slides for a portion of the scenario, from the title through the consequences of the first
question. I could test the project on a smaller scale with this prototype and solicit colleague
feedback. I could iterate more quickly, saving time on creating and editing before moving on to
the full project.
[spacer]
[spacer]
[spacer]
Full Development
I developed the final product after incorporating the feedback for the interactive prototype.
I was able to leverage “copy and paste” extensively, which speeded up the rest of the development.
I enlisted the help of colleagues again in my final testing, including the project’s performance on
varied platforms such as phones, tablets, and different browsers. The project includes animation and
transition effects, leading to fun moments like a ringing phone.
[spacer]
[spacer]
[spacer]
Takeaways
Creating this project gave me several takeaways:
The action mapping process was an essential element for focusing the project.
It helped me prioritize the client's needs and choose which instructor behaviors to guide.
Developing the storyboard deepened my understanding of the "show vs. tell" approach and
how to design realistic consequences for a learner in a safe environment.
I gained experience prototyping with Figma, honing my visual design skills, and learning
how to iterate efficiently through versions. I also had the chance to use Inkscape to
manipulate vector images, letting me fine-tune the visual experience.
I leveraged many features in Articulate Storyline that enhanced the simulation's interactivity,
making it a more immersive experience for the learner.
[spacer]
[spacer]
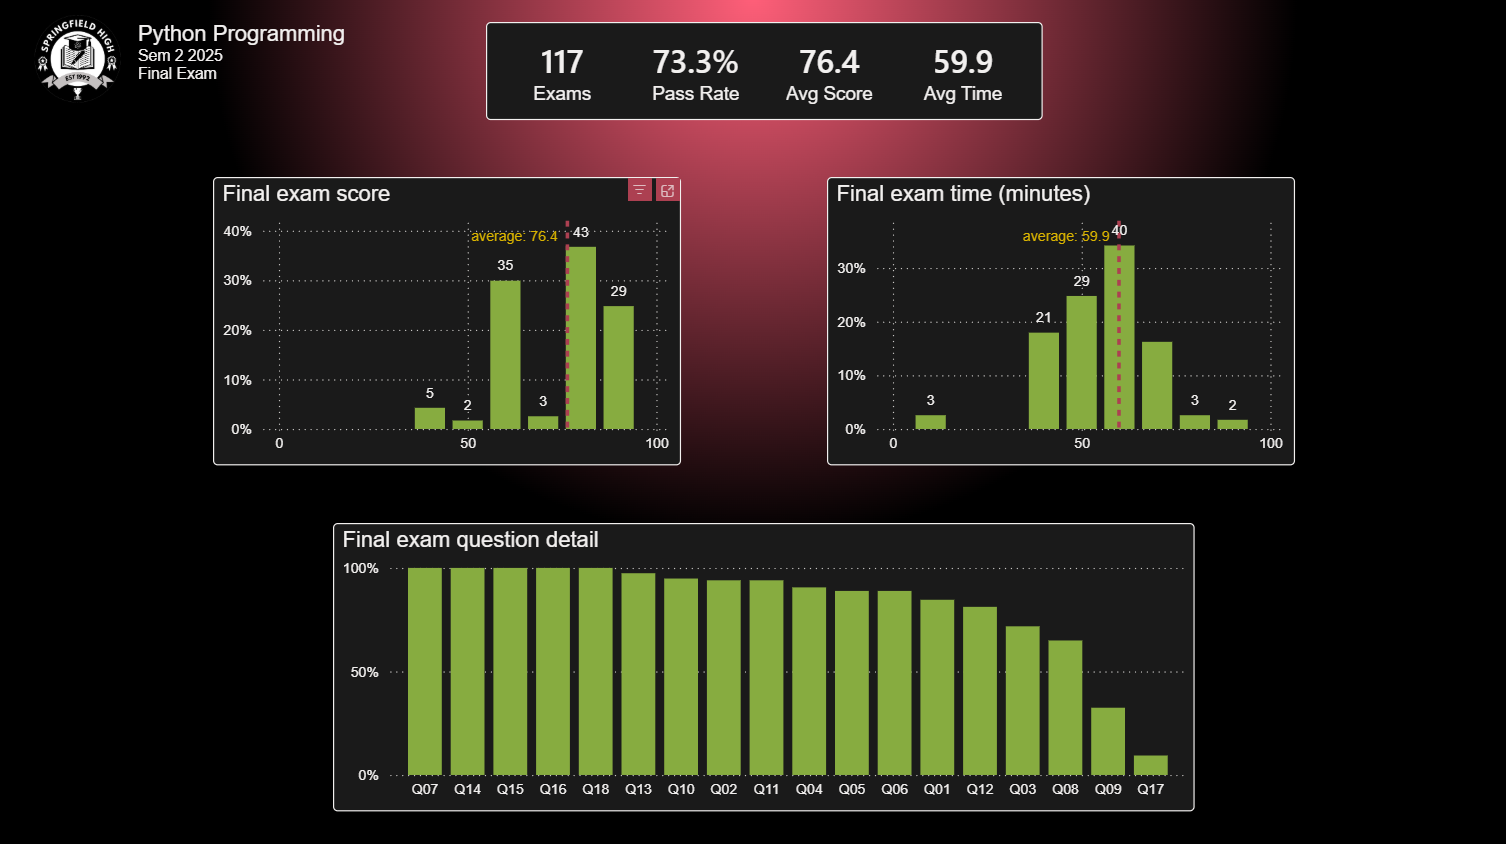
Math Quiz Readiness
an xAPI-enabled and LRS-connected eLearning experience
[spacer]
Tools for math students and their instructors.
Gauge a learner’s readiness for a quiz and aid their preparation. Save analytic data in a Learning Record Store (LRS) using xAPI.
Instructors working for an online high school math instruction provider recognized learners were
performing poorly on a particular assessment. These clients suspected the disappointing performance
was due to a few causes but didn’t have a way to test their hypotheses directly.
[spacer]
[spacer]
The Solution
The solution has two pieces:
The first is a short quiz tied to the relevant state standards with links to supplemental resources.
The quiz is low-stakes, as the results aren’t part of a learner’s grade, and they are encouraged to use the tool repeatedly
until they are comfortable with the material. The application stores the quiz results and resource utilization data
in a Learning Record Store (LRS).
The client instructors can download the quiz result and resource utilization data as an Excel file for subsequent
analysis. Individual learner data and aggregated results are available.
[spacer]
[spacer]
Analysis
I interviewed the clients to gather their thoughts about possible causes.
The two highest-ranked concerns were:
the need for more preparation by the learners coupled with inadequate self-assessment skills
an underutilization of supplementary resources.
We opted for a short self-assessment quiz for the learners, coupled with links to additional resources.
I leveraged my knowledge of relevant state standards to develop questions aligned with the course’s
objectives and to build a list of supplemental resources for each question.
[spacer]
[spacer]
Design
I iterated through screen mockups, incorporating client feedback and refining the look and usability.
As learners can take the quiz multiple times, building variety into the questions was important.
I designed JavaScript code to generate a unique version of each question for each attempt.
For the analyst portion of the solution, the clients and I decided a general-purpose approach
would be most effective in terms of time and cost. Rather than building a custom web app or Storyline
scenario, we planned an Excel download of the raw data from the LRS.
[spacer]
[spacer]
Development
I developed the learner portion of the project in Articulate Storyline. I iterated through several
versions using client feedback. We also enlisted the help of two students, gathering their
input about usability and overall quality.
For the analysis side of the project, I developed two components:
A client-side web app with which an instructor can download the quiz result and resource utilization data from the LRS and make copies of example analysis tools
A server-side tool to retrieve the LRS data, format it as an Excel file, and serve it to a user for downloading
[spacer]
[spacer]
Implementation
We first launched the learner tool in one section of a course. It was available as a link from the course inside
a Learning Management System (LMS) and via a link emailed to learners in the course.
After two weeks of use and some minor debugging, we added the learner tool to all current course sections and
emailed a link to all enrolled learners. We notified the course instructors and provided them with an explanatory
video and a link to the client app.
[spacer]
[spacer]
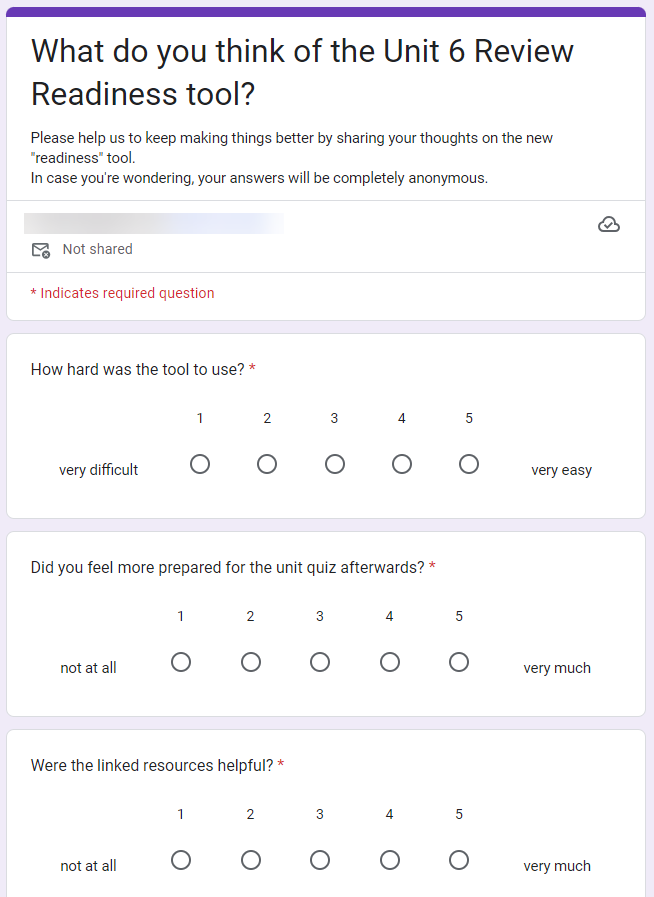
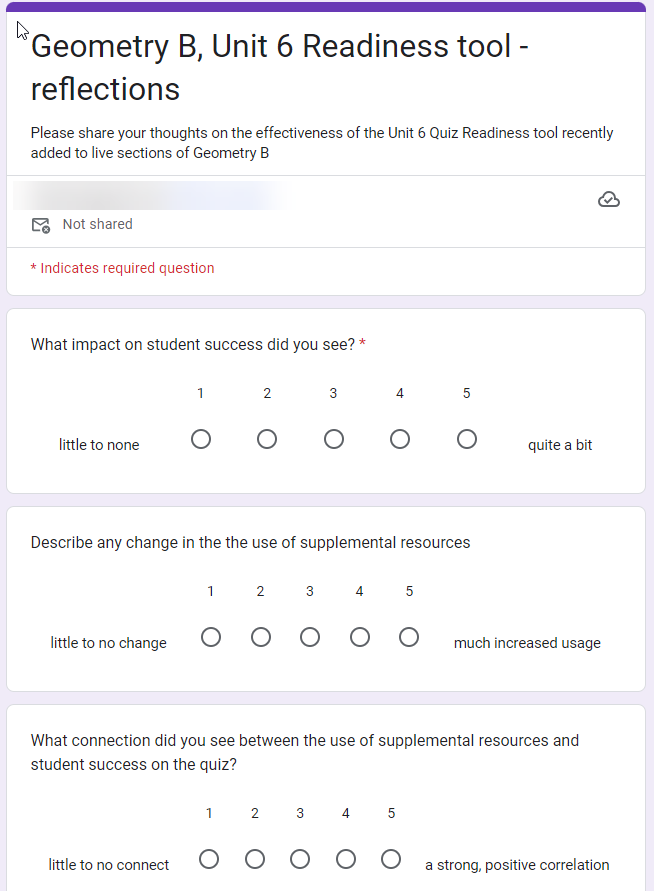
Evaluation
We conducted surveys of learners and instructors. The reception was overwhelmingly positive:
learners felt the tool was helpful, and instructors found the data analysis informative.
There is substantial interest in expanding this approach to other units within the course and possibly to additional classes.
As the learner hovers over a region on the map of Italy, this single-page tool displays the prominent wines in the area.
[spacer]
[spacer]
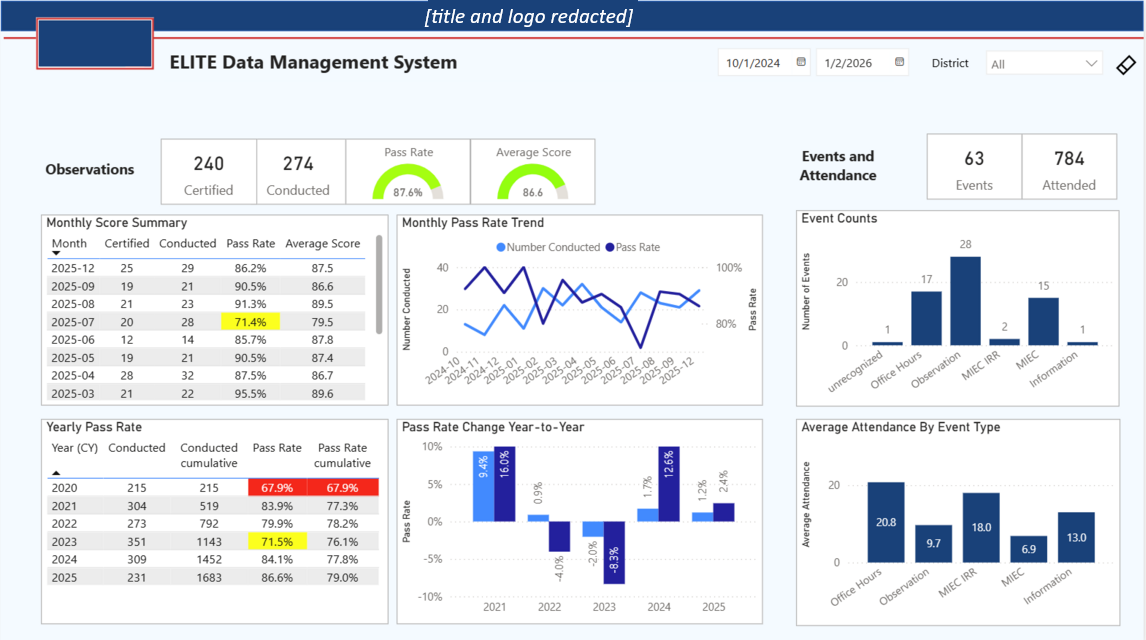
Instructor Certification Program
leveraging the Power Platform
[spacer]
Tools for a "train-the-trainer" program.
Use Power Apps and Dataverse to build scheduling, tracking, and evaluation tools for day-to-day operations. Integrate with MS Teams, Outlook, and Bookings via APIs and custom connectors Automated data flows and Power BI reporting for analytical insight.
Dataverse, Power Apps Canvas, Power Automate, Power BI, HTML, JavaScript, Node.js, APIs, MS Graph, MS Office, MS Teams, Outlook
[spacer]
[spacer]
The Problem
There are three groups of users in the program: staff, clients, and instructor candidates.
There are some shared needs as well as those particular to each user group.
shared requirements
consolidated cloud-based data management, providing a single "source of truth"
role-based security for applications and analytics
leveraging of MS Office tools for event scheduling, program communication, etc.
automated posting of scheduled events to MS Teams and Outlook calendars
staff requirements
Online tools to manage event scheduling, tracking candidates through the program, and recording candidate evaluations
reporting of planned and completed events and evaluation results, using PDF, Word, and Excel
access to the same analytic information provided to clients
client requirements
web-based reporting of candidate progress and evaluation results
role-based security at the row level
automated daily data refresh
instructor candidate requirements
automated invitations and updates to relevant program events (MS Teams and Outlook)
[spacer]
[spacer]
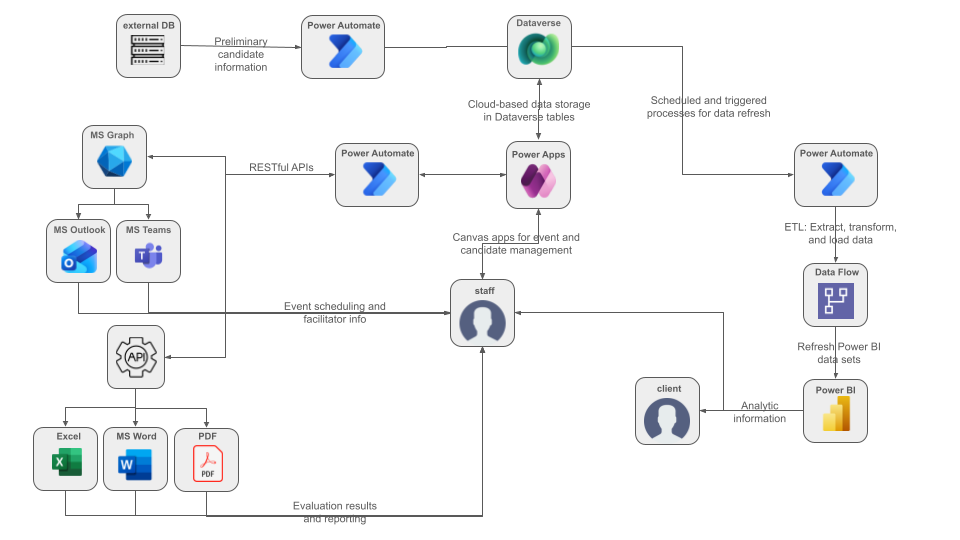
The Solution
The solution meets the program requirements by:
using Dataverse tables as the primary storage mechanism, providing role-based row-level security
providing a set of Power Apps Canvas tools for the staff to manage events, scheduling, and evaluations
integration with Teams, Outlook, Excel, Word, and PDF
using Power Automate to connect with other tools and systems, using MS Graph, custom connectors, and other APIs
combining Power Automate and data flows to refresh data extracts for Power BI
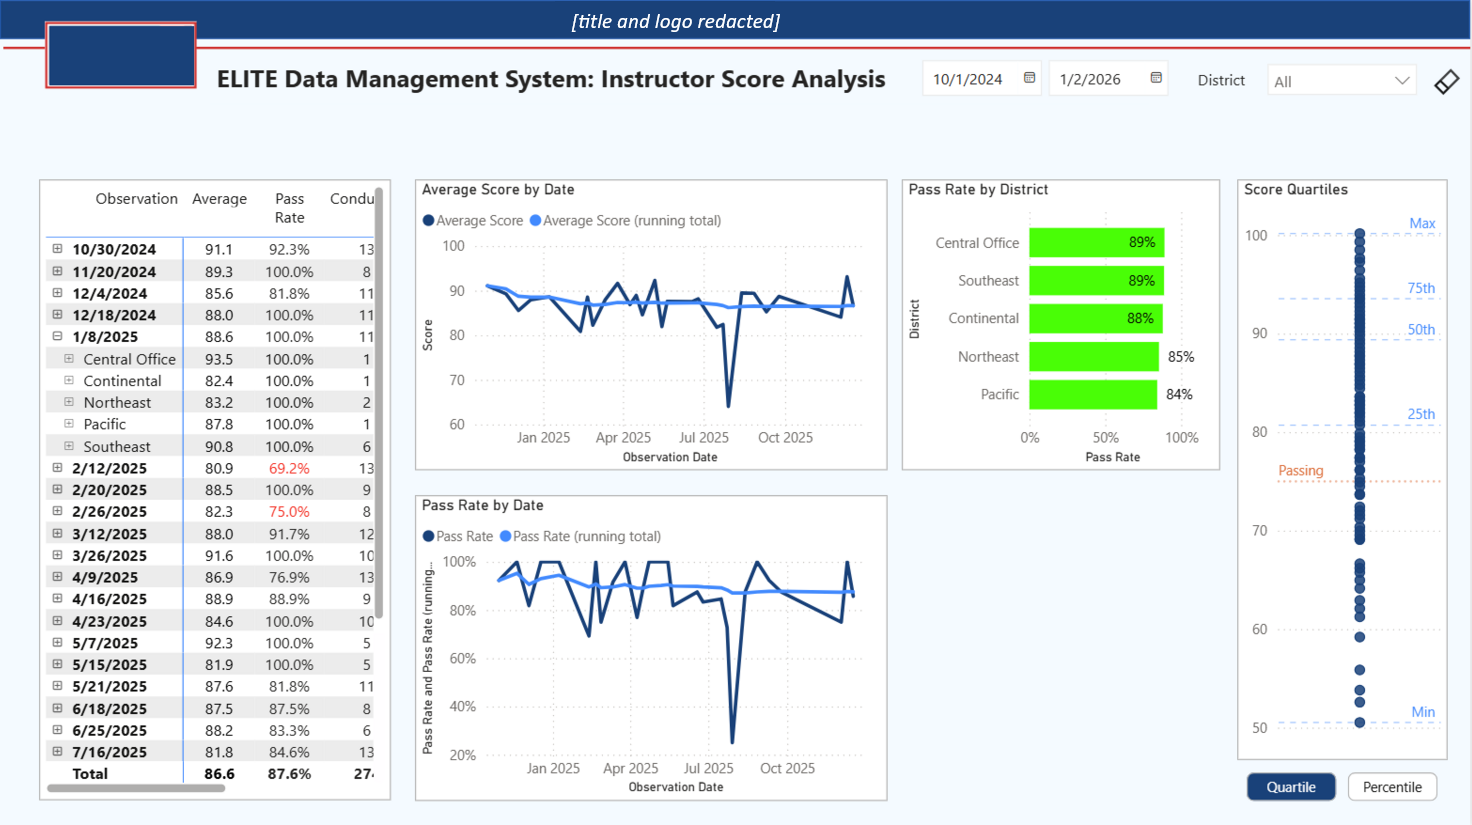
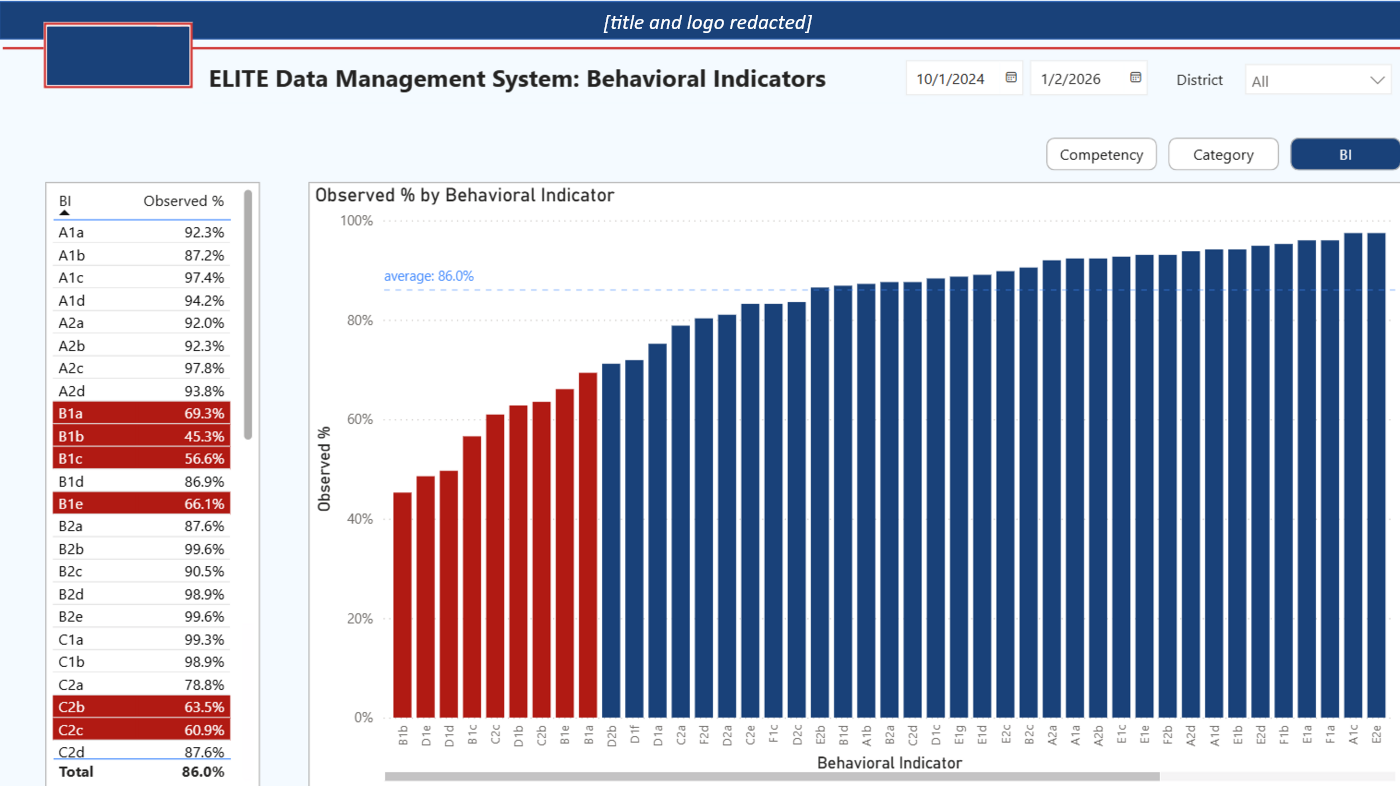
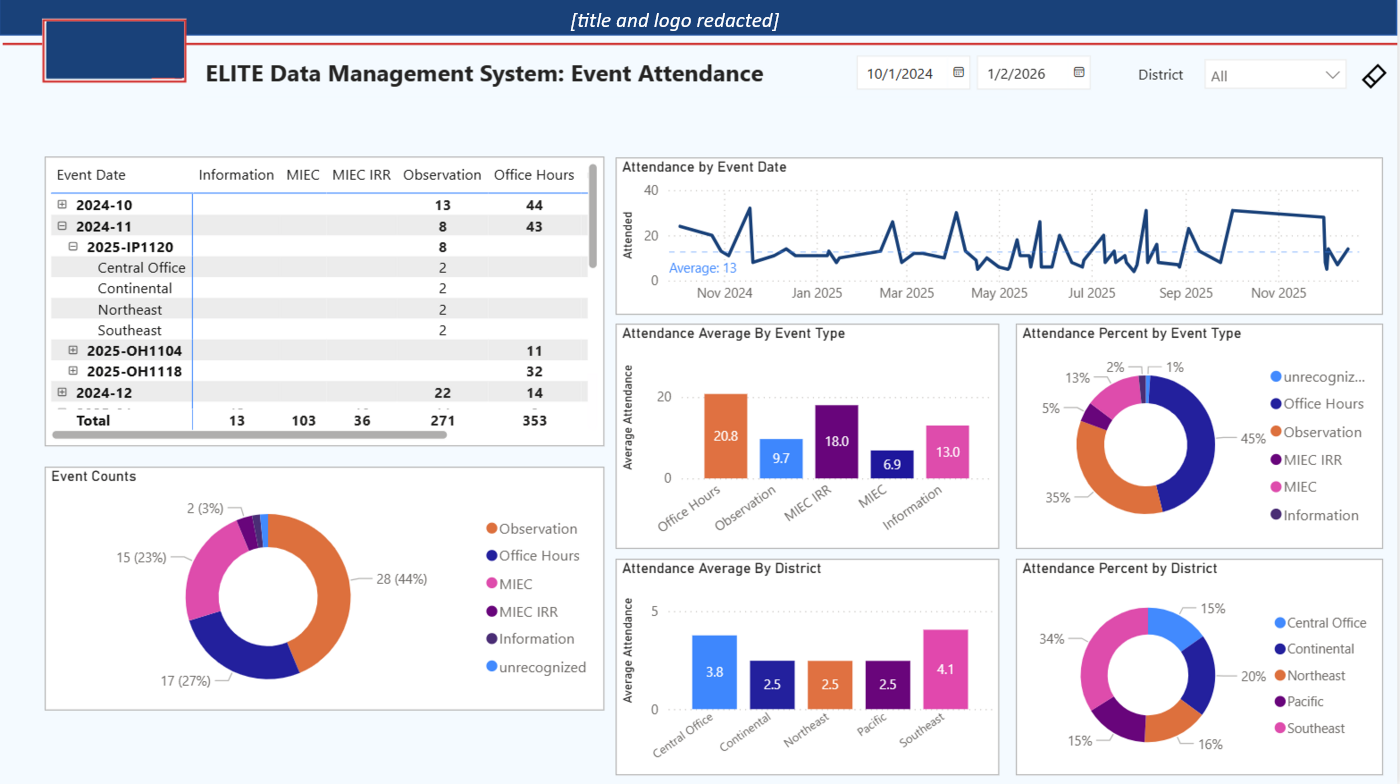
supporting analytical insights with a series of Power BI reports
model of the Instructor Certification Program project
[spacer]
[spacer]
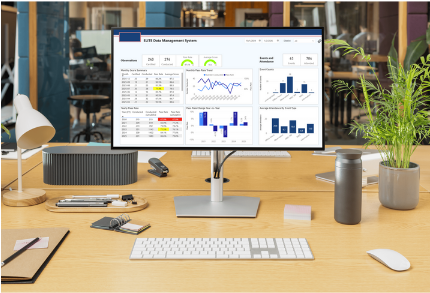
Demonstration
The Power Apps Canvas tools used by staff are proprietary and can't be demonstrated here.
Live data for the Power BI reports is similarly limited, although these screen shots give a good sense of their scope and features.
[spacer]
Job Application Tracking
help with a job search
[spacer]
Using the Power Platform to aid my job search
Use Power Apps and Dataverse to record and monitor the progress of job applications. Build automated data flows and use Power BI to discover actionable insights.
Power Apps Canvas, Dataverse, Power Automate, Power BI, Excel
[spacer]
[spacer]
The Problem
I pursued a new position in 2006 and needed a way to track all of the positions for which I applied.
I also wanted to have a small demonstration project illustrating my proficiency with Microsoft's Power Platform.
Reguirements
a secure cloud-based data storage system
a simple yet flexible data model
a front end tool to record job applications and their progress over time
(nice to have) use of Power Platform tools
(nice to have) ability to export application tracking progress to Excel
[spacer]
[spacer]
The Solution
Using a database built from Dataverse tables, a user can
enter and update job application info using a Canvas application
generate Excel exports of the application data
use a Power BI report to develop insights and decide upon appropriate actions
The data used in the Power BI report is refreshed with a daily automated ETL process. When a user requests an Excel export, Power Automate is used in conjuntion with an external REST API to create the file.
model of the job application tracking project
[spacer]
[spacer]
Data Model
A clean data model is central to both the Dataverse and the Power BI components of the project.
It is simple, yet flexible enough to support expanded functionality.
data model of the job application tracking project
[spacer]
[spacer]
Demonstration
A Power Apps Canvas app serves as the front-end for the project. While a live version isn't suitable for a demo,
this screenshot gives a good sense of how it works.
screenshot of the Canvas App for entering and maintaining information
[spacer]
A Power BI report summarizes the job search and helps illuminate underlying trends and patterns.
[spacer]
Course FAQ tools
supporting instructors and students
[spacer]
Streamline, standardize, and share course FAQs
A secure cloud-based authoring tool for instructors to create and share lists of frequently-asked-questions for asynchronous courses,
backed by a SQL database. A simple service to provide an interactive web page of a given FAQ list, suitable for embedding in an online course.
Instructors leading asynchronous online courses need a way to answer frequently-asked student questions.
The Learning Management Systems (LMS) used to host the courses don't natively provide a solution.
The instructors dont' have the time, and in many cases the technical ability, to add FAQ information
to a course each time it is taught.
Requirements
Intuitive instructor web app to author and maintain lists of FAQs, organized into named groups.
Secure cloud-based storage for FAQs
Ability to share sets of FAQs between instructors
The authoring tool provides a link to an online page displaying a selected FAQ set
The authoring tool provides embed code suitable for adding to a page in most LMSs
[spacer]
[spacer]
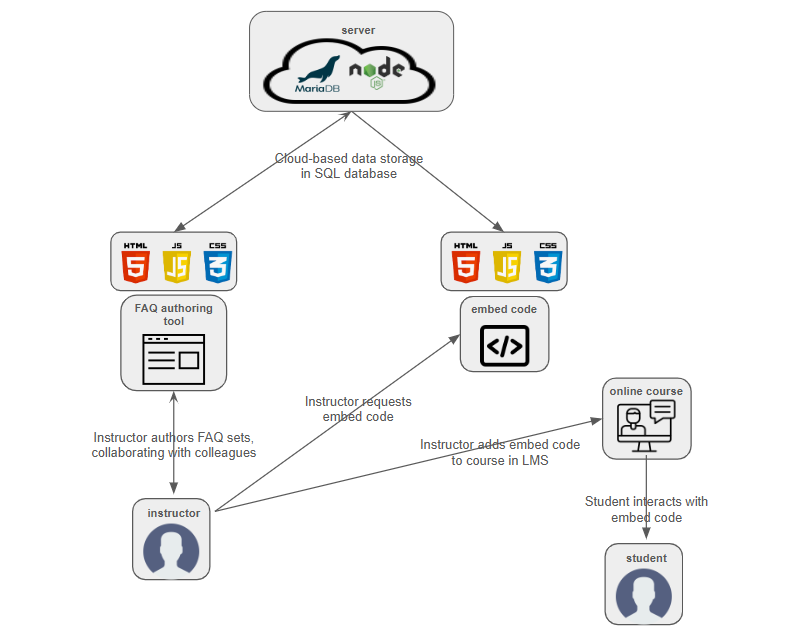
The Solution
The project is built upon information stored in and served from a cloud-hosted server
The host runs a MariaDB (MySQL) database and serves from a Node.js environment
Clients are served HTML/CSS/JavaScript code and pages
Instructors can compose and maintain lists of FAQs, and map them into named, shareable sets
An FAQ set or combination of them can be served as a standalone page or via embed code
The embed code is suitable for use in an online course, managed by an LMS
model of the FAQ composer project
[spacer]
[spacer]
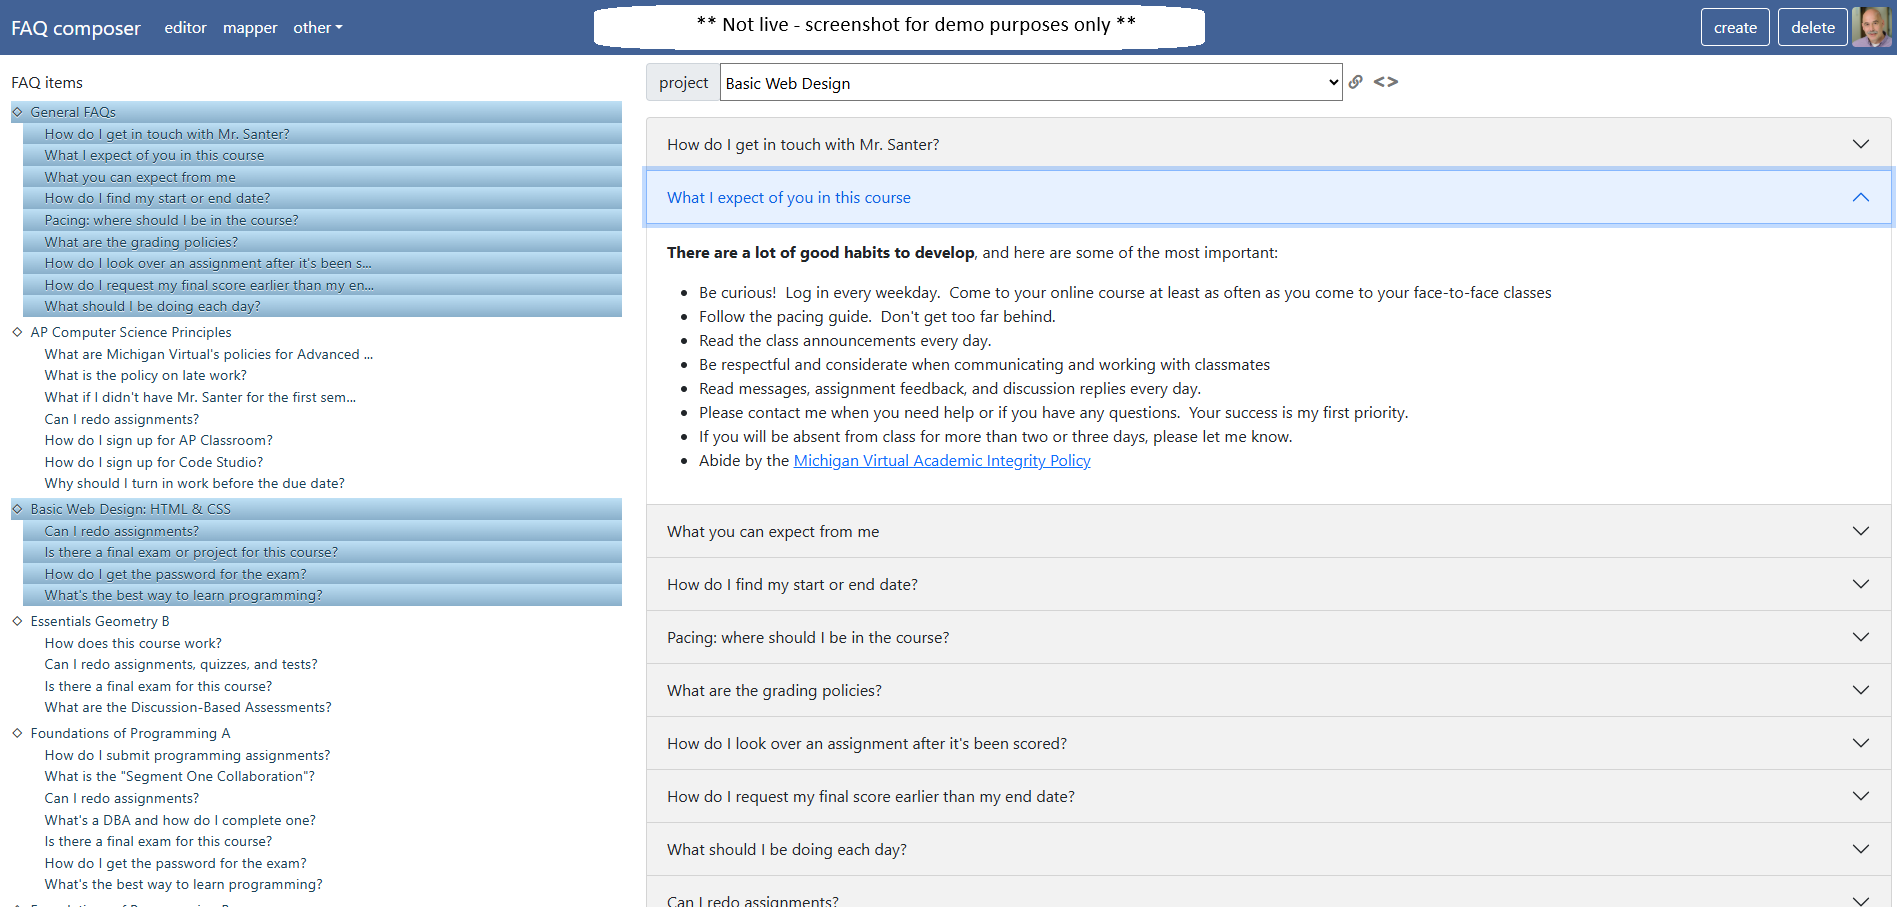
Demonstration
A web app (HTML/CSS/JavaScript) provides an authoring tool to instructors.
It supports the grouping of FAQs into named sets, which can be mapped in any combination to a particular course.
Once a set of FAQs has been configured for a course, the instructor can generate a link or embed code to use elsewhere.
Most commonly, the FAQs are embedded in the Learning Management System (LMS) supporting an online course.
While a live version isn't suitable for a demo, this screenshot gives a good sense of how it works.
screenshot of the web app for authoring FAQs
[spacer]
This demo shows an FAQ set embedded in an online course.
The LMS and course aren't real, but the FAQs are live and interactive.
[spacer]
Power BI Showcase
demos and screenshots
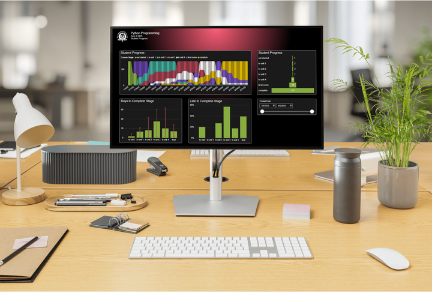
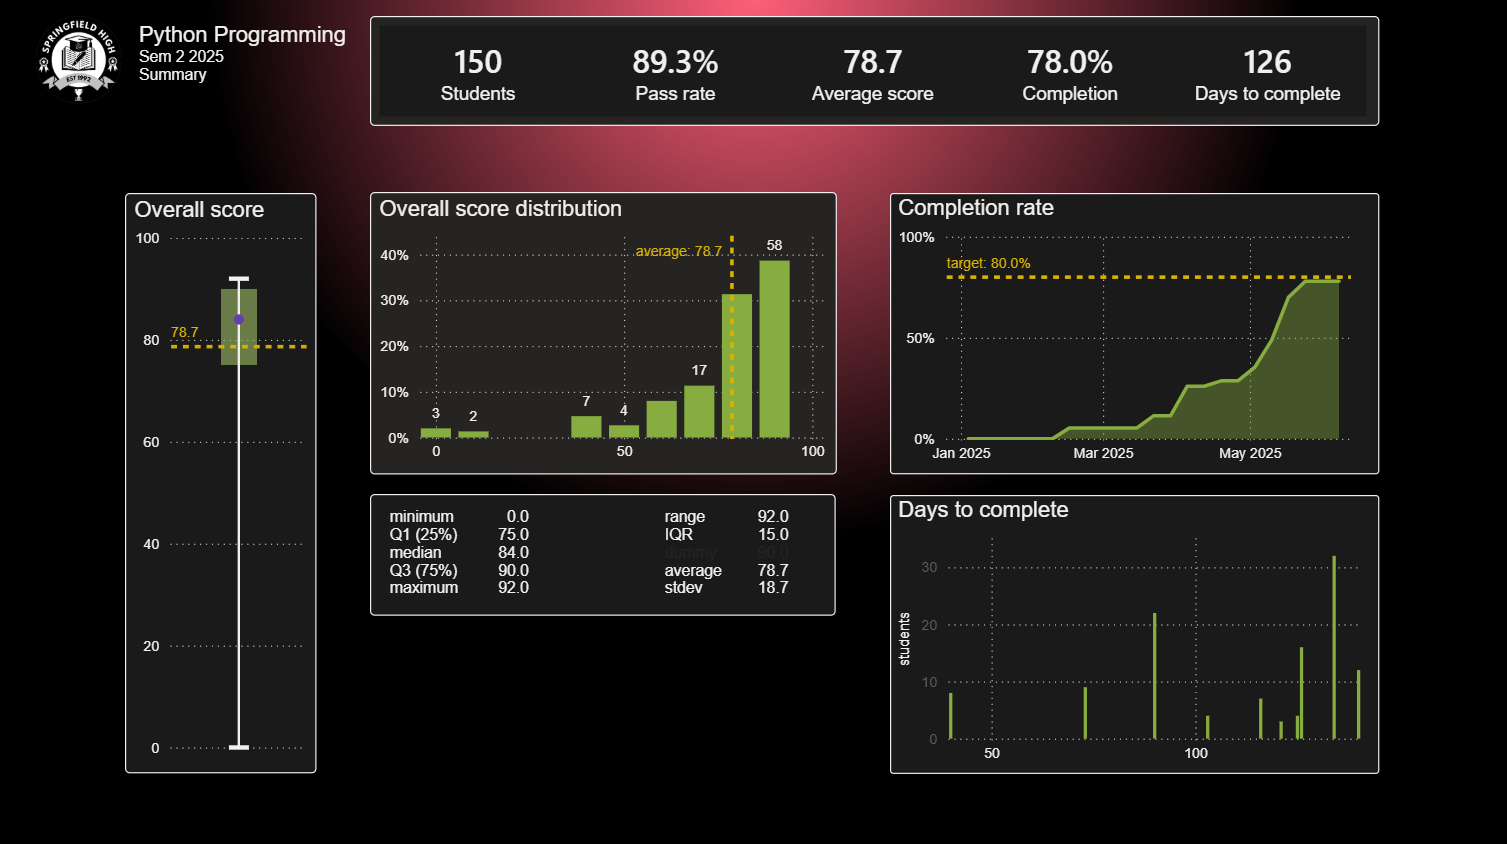
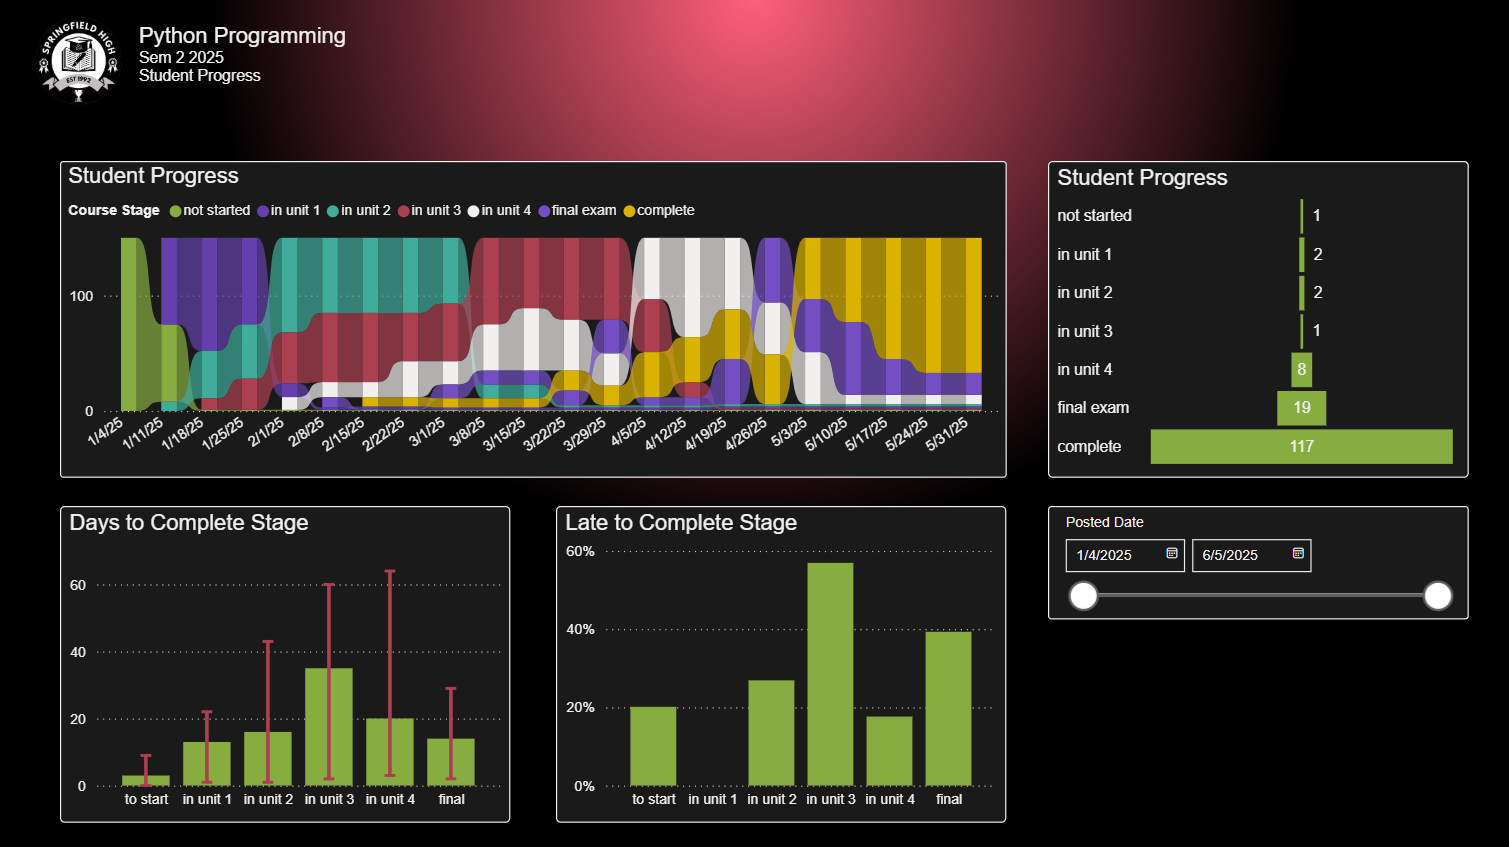
Student Progress
Insights for instructors tracking the progress of their high school students in online courses.
You are welcome to explore this carousel of screenshots and to try a live demo,
or to download a copy of the Power BI source file. Note: The name of the school and any identifiable student information has been scrubbed.
[spacer]
[spacer]
Instructor Certification Program
This is the reporting portion of a larger project tracking candidates through an instructor
certification program.
These reports are proprietary so a live demo is not available.
You are welcome to explore this carousel of screen shots and to look more closely at the project details Note: The logo, project name, and any identifiable candidate information has been scrubbed.
[spacer]
[spacer]
Job Application Tracking
This is the reporting portion of a personal project, tracking job applications.
You are welcome to explore this screen shot, to try a live demo, and to look more closely at the project details, or to download a copy of the Power BI source file.
[spacer]
[spacer]
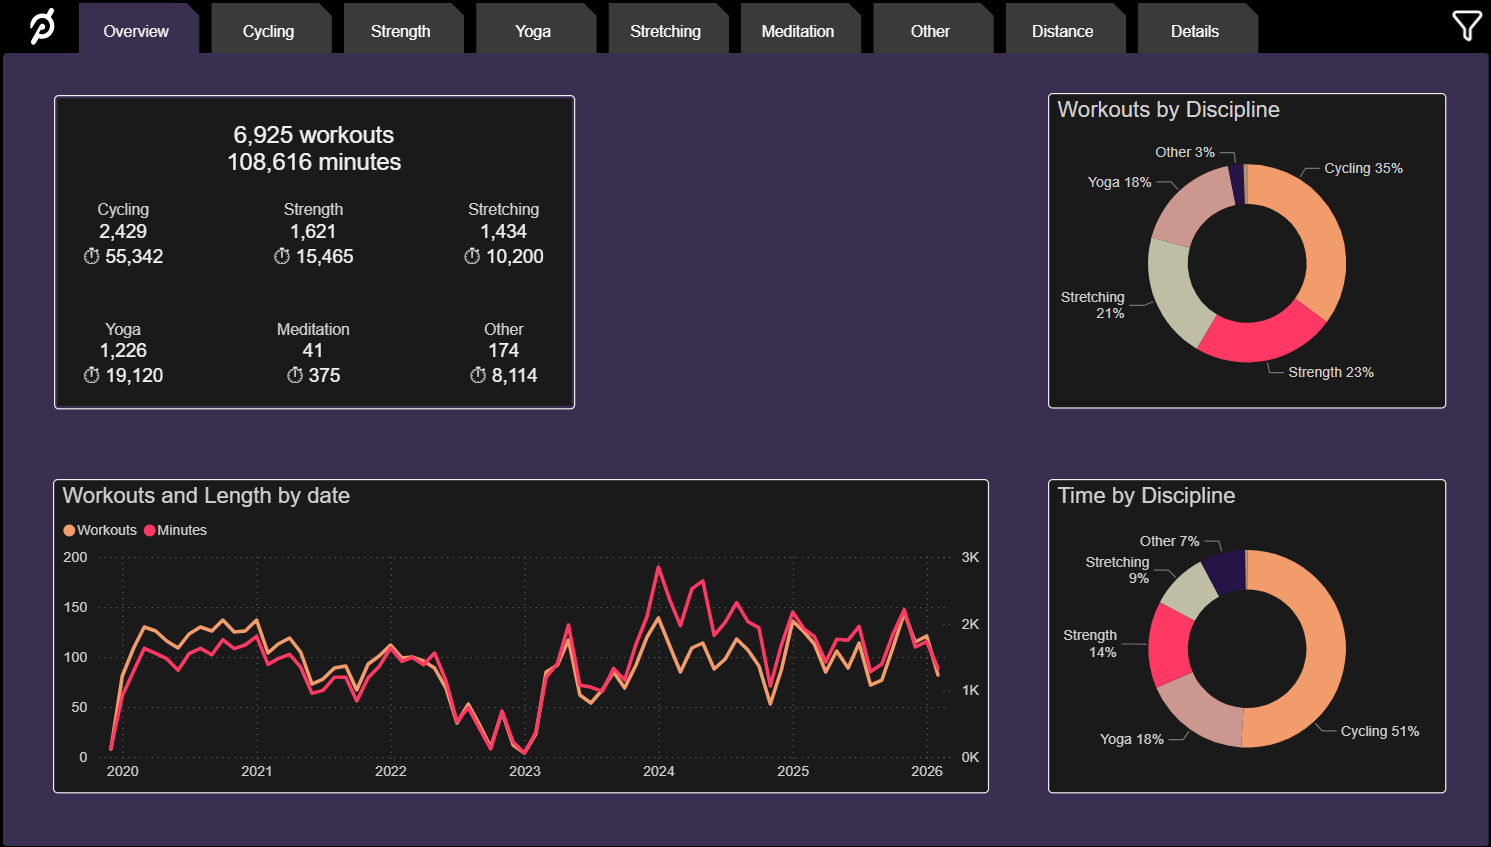
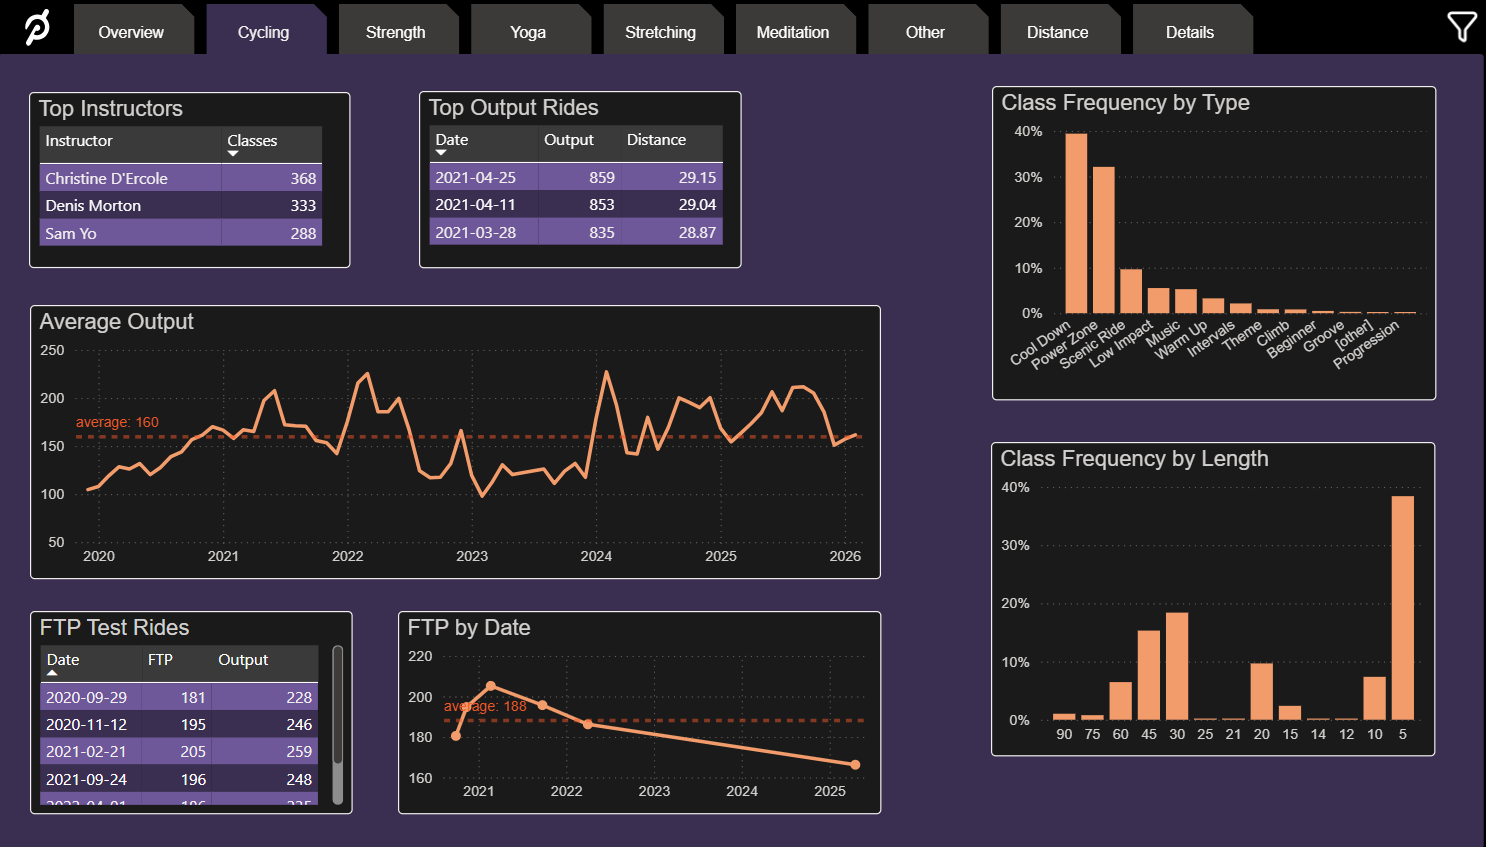
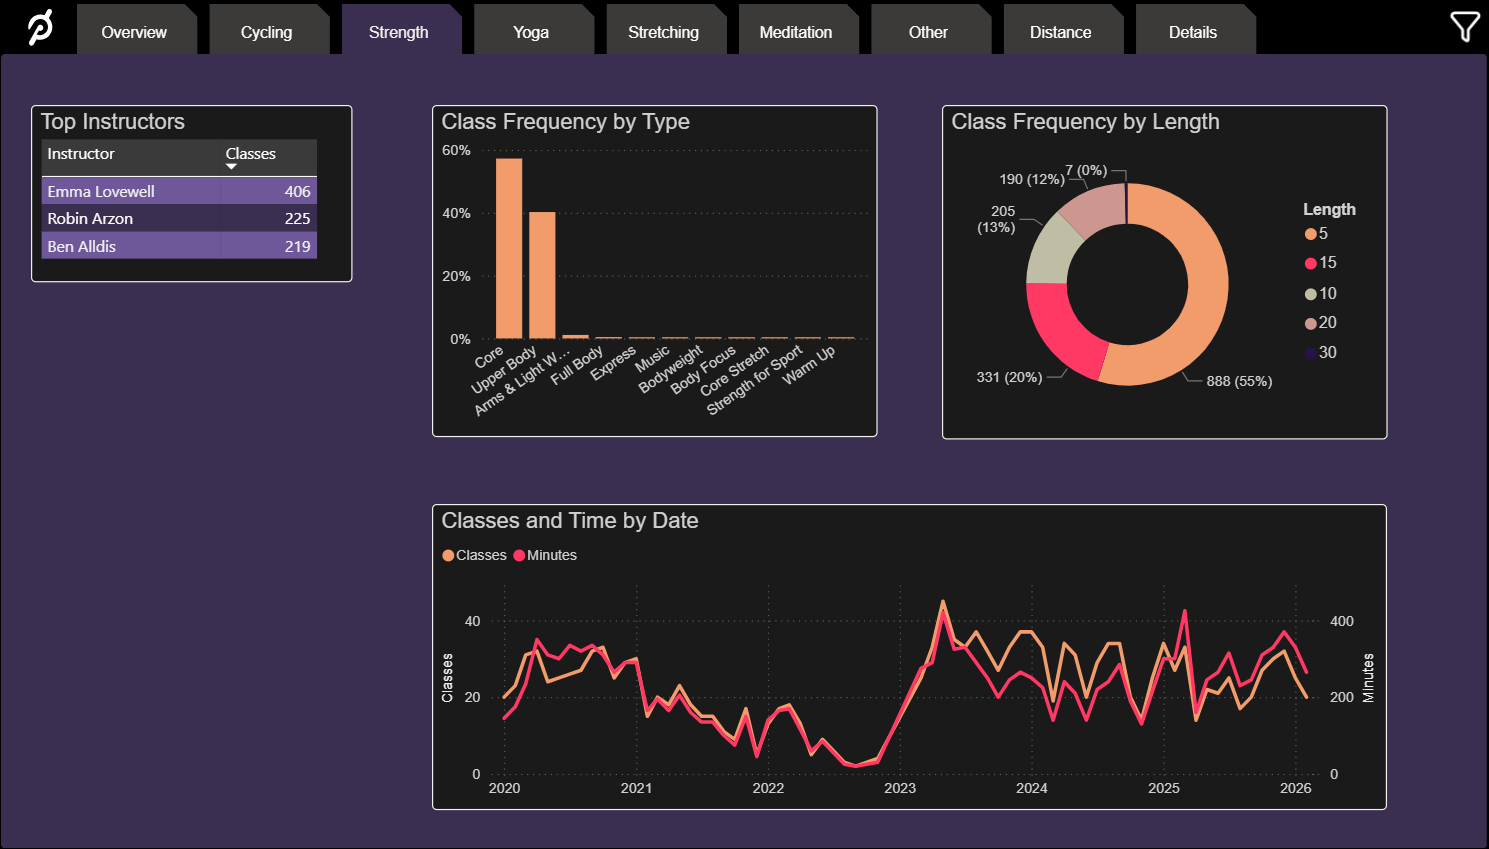
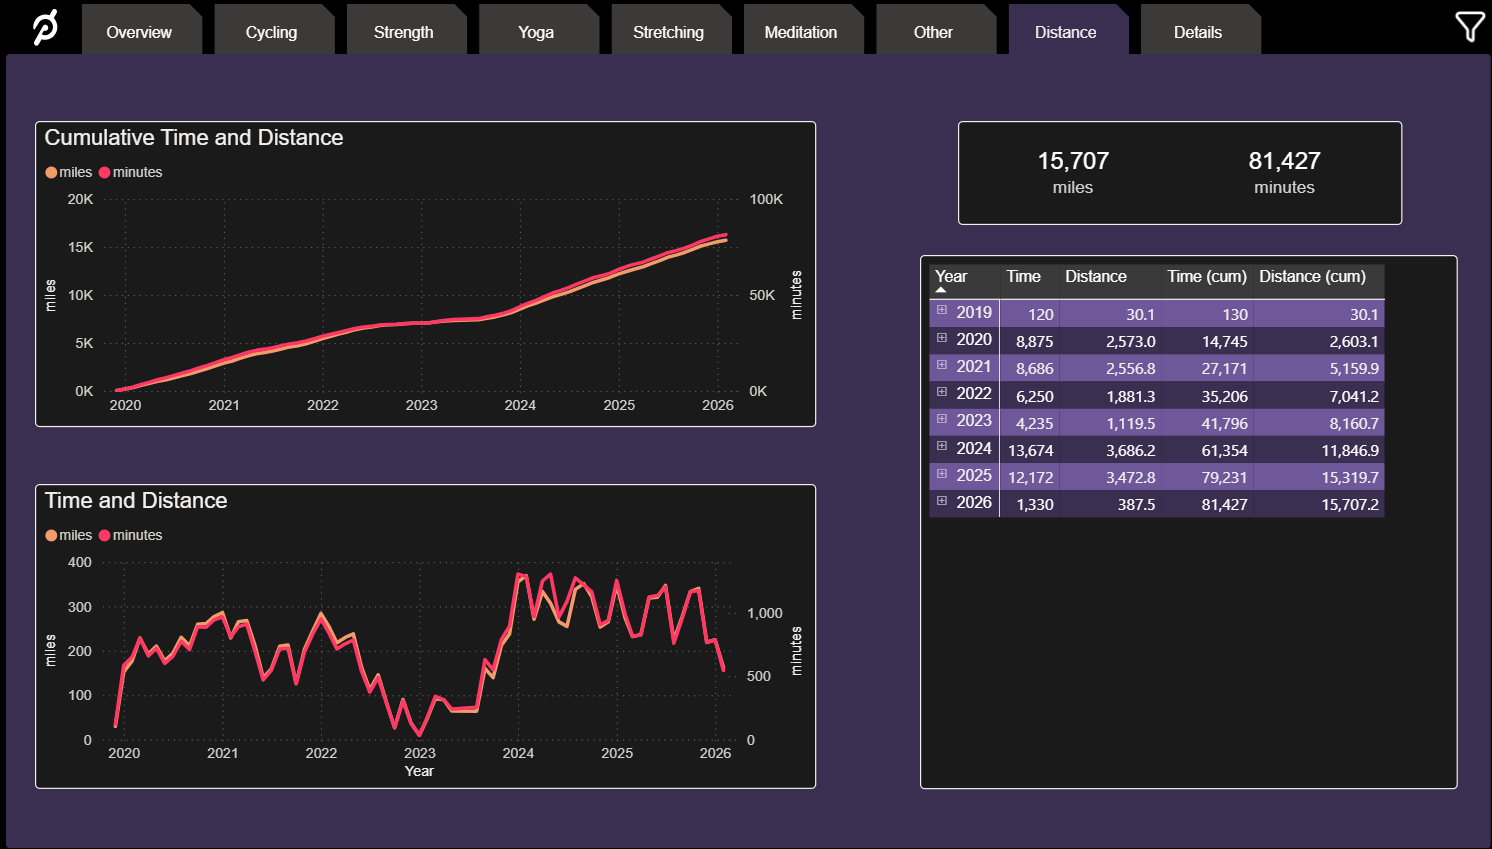
Peloton Analytics
I am an avid user of the Peloton training platform, and in particular its cycling classes.
I developerd these reports to gain insight into my fitness regimen over time.
You are welcome to explore this carousel of screenshots and to try a live demo,
or to download a copy of the Power BI source file.
[spacer]
Supplemental Artifacts
instructional design content
Overview
Here are more artifacts from my instructional design and education path,
along with thoughts about recommendations and best practices.
[spacer]
Course Outline
One of the courses I worked to develop and then taught with Michigan Virtual was AP Computer
Science Principles. It is a two-semester course designed to introduce students to the broader
field of computer science. It is fully recognized by the College Board and certified by Quality Matters.
I chose to include the course syllabus in my portfolio as it demonstrates detailed alignment to
the required standards with a clear and logical progression of topics and activities.
[spacer]
Sample Lesson Materials
I created the curriculum and taught an Advanced Placement statistics course to
high school students. It includes this lesson introducing the Five Number Summary.
As part of a web coding course I designed and taught, students were assigned a project
where they developed a weather app. The main handout describes the project, its objectives and requirements, milestones, roles, and the evaluation rubric.
I’ve also included a document that describes the project’s alignment to the Computer Science Teacher’s Association standards.
I’ve included another rubric used in a different context. As part of my position with Victor 12,
I routinely evaluated candidates in an adult instructor certification program. We used this instructor evaluation rubric to document the evaluations.
[spacer]
Instructional Design Process
Here are some high-level summaries of some key stages in my instructional design process.
Merely presenting material is not enough. Immersive experiences, genuine situations, and relatability are critical to learner success.
One size does not fit all
Learning experiences should be responsive to the user, sensitive to their needs, and adapt based on results.
Wrong answers are as important as right ones
Learners should not fear mistakes. They are opportunities, offering insight and the chance to reflect and grow.
"We've always done it that way" drives me crazy
A tried and true solution may be the best choice, but we should never be limited to them.
[spacer]
I bring experience
teaching knowledge
theoretical and practical, acquired in face-to-face and virtual classrooms
software development
analysis, design, development, testing and support
project management
leading teams to deliver projects on time and within budget
[spacer]
and a bit more
[spacer]
I spend a lot of time hiking, cycling, and traveling when I can.
I'm happiest when I can explore somewhere new in detail, rather than using a "seven countries in seven days" approach.
I moved to Chicago not that long ago, transitioning from the suburbs to a downtown apartment.
It's been a fantastic place to explore - architecture, food, events - it's got it all.